Solved Papers
Every question from the 2025-26 Final Examination (25 Nov 2025) and the Re-Examination (02 Feb 2026) — all 20 questions across all five units — answered in full and point-wise, written the way you would write it on the answer sheet.
Each question shows the exact wording from the paper, then an answer plan (the headings to put on your sheet), then the full answer in numbered points, then a note on what the official synoptic expects.
A warning about the official answer key. The university's synoptic is a marking outline, not a model answer. For several questions it gives four or five bare phrases where the question carries 10 marks. Reproducing it word for word would not earn full marks. So these answers are built from the textbook and your unit notes, structured so a 10-mark question gets a 10-mark answer — and where the synoptic is unusually thin or loosely worded, that is flagged rather than copied.
Scope. These are Term End Examination papers, so they cover all five units. Fourteen answers were written for the midterm portion (Units 1–3, Lectures 1–16); the remaining six — Final Q5, Q7, Re-Exam Q1(d), Q5, Q6 and Q7 — come from Inflation and the Phillips Curve (Unit 3, Lectures 17–18), Central Bank and Money (Unit 4) and Government and Private Business (Unit 5), and are now solved in place.
- Duration 2 hours, maximum marks 50 (scaled from 100).
- 7 questions of 10 marks each. Q1 is compulsory; attempt any 4 of the remaining six. In all 5 questions are to be attempted.
- Q1 is always four short parts of 2.5 marks each under the heading "Answer Briefly". These are definition-plus-explanation answers — roughly 6 to 10 lines each, with the definition first.
- Every new question must start on a fresh page.
- Time budget: 2 hours ÷ 5 questions ≈ 22 minutes per 10-mark question, leaving time to read and check. For Q1 that is about 5 minutes per part.
Both papers follow the identical structure: a circular-flow / IS-LM question and a stabilisation-policy question in the middle, and the last two or three questions from inflation, the central bank and Unit 5. Half the optional questions came from the post-midterm units — see the summary at the end of this page.
Final · Q1(a) — Microeconomics vs Macroeconomics 2.5 marks · Unit 1
"Highlight the difference between studying Microeconomics and Macroeconomics?" — CO1 SO1, BL-Understand, 2.5 marks
Define both → give the standard distinction (Ackley) → list three or four points of difference → close with one concrete example. In 2.5 marks, the example is what separates a 2 from a 2.5.
Microeconomics studies the small individual units of an economy — a single consumer, a single firm, a single industry or a single market — and explains how the prices of particular products and factors are determined and how resources are allocated among competing uses.
Macroeconomics studies the behaviour of the economic system in totality. It deals with large aggregates such as total employment, national income, aggregate demand, aggregate supply and the general price level, and is therefore called the study of aggregates.
The main differences are:
- Unit of study. Micro studies the individual part; macro studies the economy as a whole.
- Subject matter. Micro explains relative prices and the allocation of resources; macro explains the general price level, national income, employment and growth.
- Method. Micro uses partial equilibrium analysis, assuming other things remain equal; macro uses general equilibrium analysis, because the sectors of an economy depend on one another.
- Policy use. Micro guides the decisions of a firm or household; macro guides government fiscal and monetary policy.
Example. Microeconomics studies how a single firm fixes the price of its product; macroeconomics studies what causes inflation in the entire country. As Gardner Ackley put it, macroeconomics concerns the aggregate volume of output, the extent to which resources are employed, the size of national income and the general price level, whereas microeconomics concerns the division of total output among industries, products and firms.
The synoptic gives two short definitions and one example — micro fixes one firm's price, macro explains national inflation. It does not ask for the four points of difference, but including them costs you thirty seconds and makes the answer complete. Keep the example: the key explicitly rewards it.
Revise → Short Notes 01 · Unit 1
Final · Q1(b) — MPC and APC 2.5 marks · Unit 2
"What do you understand by term Marginal propensity to consume and average propensity to consume?" — CO2 SO2, BL-Understand, 2.5 marks
Formula first, then the meaning of each in one sentence, then the relationship between them. Write both formulas before you write anything else — this question is almost entirely about not confusing the two.
Marginal Propensity to Consume (MPC) is the ratio of the change in consumption to the change in income. It answers the question: out of one extra rupee of income, how much extra is spent on consumption? It is the slope of the consumption curve, and it is written MPC = ΔC/ΔY.
Average Propensity to Consume (APC) is the ratio of total consumption expenditure to total disposable income. It answers: out of every rupee of income the household has, what proportion in total is being consumed? It is written APC = C/Y.
Relationship between them. MPC always lies between zero and one, because a person cannot spend more than the whole of an extra rupee. In the linear Keynesian consumption function, MPC stays constant while APC falls as income rises, because the autonomous part of consumption becomes a smaller share of a growing income. Therefore MPC is always less than APC. MPC is also the key to the multiplier, since the multiplier equals 1 ÷ (1 − MPC).
Writing APC = ΔC/ΔY. APC uses totals, MPC uses changes. If the formulas are swapped, the whole 2.5 marks go, however good the explanation is. Write the two formulas at the top of the answer where the examiner sees them first.
Revise → Short Notes 10 · Unit 2 · sums in the Numerical Lab
Final · Q1(c) — Disadvantages of High Inflation 2.5 marks · Unit 3 · Lec 17
"What are various disadvantages of having High inflation in economy?" — CO2 SO1, BL-Remember, 2.5 marks
One-line definition of inflation → then a straight list of harms, each with a few words of explanation. This is a "Remember"-level question, so the marks are in coverage: list six or seven harms rather than explaining two at length.
Inflation means a persistent rise in the general price level. When the price level rises, the value of money falls. High inflation has the following disadvantages:
- It erodes the purchasing power of money. Each rupee buys fewer goods and services, so the real income of the people falls even when their money income is unchanged.
- It hurts fixed-income groups the most. Workers on fixed wages, salaried employees and pensioners suffer, because their nominal incomes are fixed by contract and do not rise as fast as prices. It is rightly said that inflation is enemy number one of the poor.
- It redistributes income and wealth unfairly. It harms creditors and benefits debtors, since loans are repaid in money of lower real value. It benefits businessmen, producers and traders, whose prices and inventory values rise faster than their costs.
- It erodes wealth held in money form. Savings deposits, bonds and debentures have values fixed in money terms, so inflation reduces their real worth and the real rate of interest earned on them.
- It has distortionary effects and misallocates resources. All prices do not rise to the same extent, so relative prices are distorted and resources move into the wrong uses, causing a loss of economic efficiency.
- It creates uncertainty. Nobody can be sure about future incomes and returns, which makes rational saving and long-term investment planning very difficult.
- It discourages saving and slows growth. People rush to spend before prices rise further, and what they do save goes into unproductive assets such as gold, jewellery and real estate rather than into productive investment.
- It worsens the balance of payments. Domestic goods become costly, so exports fall and imports rise, creating a trade deficit and pressure on the exchange rate.
For these reasons controlling inflation and maintaining price stability is a primary objective of the government's fiscal policy and the central bank's monetary policy.
The synoptic lists only five bare phrases — distortionary effects, affects allocation of resources, erodes purchasing power, erodes wealth, creates uncertainty about incomes and returns. Those five are the marking points, so make sure all five appear using those words. But five bare phrases are thin for 2.5 marks, so add the fixed-income and creditor–debtor points and the one-line definition; they cost you two extra lines and make the answer look complete.
Revise → Short Notes 22 · Unit 3 · Effects of Inflation · Unit 1 · inflation as a major issue
Final · Q1(d) — Role of the Central Bank in Price Stability 2.5 marks · Unit 3 + Unit 4
"Illustrate the role of Central Bank in price stability?" — CO3 SO3, BL-Applying, 2.5 marks
The command word is "illustrate", so name the instruments and say which way each is moved. State the objective → name the four quantitative tools with their direction → close with why price stability matters.
The central bank is the apex monetary authority of a country — in India, the Reserve Bank of India. Unlike an ordinary bank it is not run for profit; its guiding principle is to act in the public interest and to promote financial and economic stability. Price stability, that is, containing inflation, is its dominant objective, because monetary policy is the instrument best suited to that particular goal.
It maintains price stability by controlling the cost of credit and the availability of credit, through the following instruments:
- Interest rate policy (bank rate and repo rate). To curb inflation the RBI raises the repo rate. Funds become costlier for commercial banks, they raise their own lending rates, borrowing for investment and for cars and houses falls, and aggregate demand comes down. Higher deposit rates also induce households to save more and consume less.
- Reserve requirements (CRR and SLR). Raising the cash reserve ratio forces banks to keep more of their deposits as cash with the RBI, reducing what they can lend. Raising the statutory liquidity ratio mops up the extra liquid assets in the banking system. Both contract credit.
- Open market operations. The RBI sells government securities in the open market; buyers pay out of their cash reserves, banks' reserves fall, and their capacity to lend is directly curtailed.
- Selective credit controls. By raising the margin requirement against stocks of sensitive commodities such as foodgrains, oilseeds and sugar, the RBI makes speculative hoarding costlier, forcing hoarders to release stocks and bringing those particular prices down.
Why it matters. Stable prices build confidence in the economy: they encourage saving, make real returns predictable, protect the real incomes of the poor, keep exports competitive, and provide the environment in which long-term investment and growth can take place.
The synoptic answer is a single sentence — the central bank maintains price stability by controlling inflation through interest rate policies, reserve requirements and open market operations, and stable prices encourage saving, investing and long-term growth. Those three instruments plus the confidence argument are the marking points. Everything else above is padding that makes the answer read as a 2.5-mark answer rather than a one-liner.
Revise → Short Notes 18, 26 · Unit 3 · Monetary Policy · Unit 4 · Objectives of the Central Bank · Credit Control
Final · Q2 — Subject Matter, Features and Importance of Macroeconomics 10 marks · Unit 1
"Elaborate subject matters of Macroeconomics, also explain its main features and why it is important for understanding how a country's economy works?" — CO2 SO2, BL-Applying, 10 marks
- Definition + Subject Matter (about 3 marks)
- Main Features (about 3–4 marks)
- Importance (about 3–4 marks)
Marks in a three-part question are distributed across the three parts. An answer that spends all its length on the definition and one line on importance cannot score above half, however good the definition is.
Meaning. Macroeconomics studies the behaviour of the economy as a whole rather than of individual markets. It is the study of aggregates — it examines broad indicators such as national income, total employment, aggregate demand, aggregate supply, investment, inflation and economic growth.
1. SUBJECT MATTER OF MACROECONOMICS
The subject matter of macroeconomics is to explain what determines the level of total economic activity in a country, what causes it to fluctuate in the short run, what makes the general price level rise, and what makes productive capacity grow in the long run. It has four branches:
- Theory of income and employment. It explains what determines the level of national income and employment, and why an economy can remain in equilibrium below full employment. Under it come the theory of the consumption function and the theory of investment.
- Theory of the general price level. It explains what makes the average of all prices rise or fall, and therefore explains inflation and deflation.
- Theory of economic growth. It explains how a country raises its productive capacity and national income over the long run, which depends on saving, investment, human capital and technological progress.
- Theory of economic policy. It explains how the government uses fiscal and monetary policy to remove unemployment, control inflation and accelerate growth.
2. MAIN FEATURES OF MACROECONOMICS
- Aggregate study. It focuses on totals — total output, total demand, total supply, total employment — and not on any single unit.
- Interdependence. It analyses how the different sectors — household, business, government and foreign trade — interact with and depend upon one another, so that a change in one spreads to the rest.
- Policy orientation. Its purpose is practical: it helps frame fiscal and monetary policies to maintain economic stability.
- Dynamic nature. It studies both short-run fluctuations, that is, business cycles, and long-run economic growth.
- General equilibrium method. Because everything in the economy depends on everything else, macroeconomics cannot assume "other things remaining the same" the way microeconomics does.
- It works through aggregate demand and aggregate supply, which play the same central role that the demand and supply of a single good play in microeconomics.
3. IMPORTANCE OF MACROECONOMICS
- It measures the overall performance of the economy. National income and GDP figures tell us whether the country as a whole has grown, and per-capita income indicates the general standard of living.
- It explains the causes of the problems that hurt people most. Unemployment wastes resources and causes real human suffering; inflation erodes real incomes, redistributes income in favour of the rich and pushes people below the poverty line.
- It is the basis of government policy. Only by knowing the causes of recession and inflation can the government adopt expansionary policy in a slump and tight policy against inflation.
- It guides economic planning. Plan targets for growth, saving and investment are all framed in macroeconomic terms.
- It helps business firms. Firms do not work in a vacuum. The level of overall economic activity, aggregate demand conditions, government fiscal and monetary policy and the rate of inflation together make up the business environment in which managers take decisions. Forecasts of future demand and all investment decisions rest on the state of the economy and its growth prospects.
- It helps individuals decide. Somebody who expects higher inflation can act in advance to protect real income and real interest earnings; decisions about buying a house or a car depend on the expected state of the economy.
- It ensures sustainable growth and improves living standards, which is the ultimate purpose of studying the subject at all.
Conclusion. Macroeconomics is essential because the economy as a whole does not behave like the sum of its parts — what is true of the part need not be true of the whole. It is this fallacy of composition, illustrated by the paradox of thrift, that makes a separate aggregate study necessary, and it is the reason macroeconomic understanding is indispensable to governments, businesses and individuals alike.
The synoptic asks for exactly four features — aggregate study, interdependence, policy orientation, dynamic nature — followed by a short importance paragraph. Those four feature names are the marking points and must appear using those words. The synoptic's subject-matter section is only two lines, which is well short of a 10-mark answer; the four-branch structure above is the textbook version and gives the answer the length it needs.
Revise → Short Notes 02 · Unit 1
Final · Q3 — Injections and Leakages in the Circular Flow 10 marks · Unit 2
"Evaluate the benefits of injection in circular flow on income in the economy and Elaborate on the possible effects of leakages in the economy." — CO3 SO2, BL-Applying, 10 marks
- Explain the circular flow in two lines and draw the four-sector diagram with leakages and injections marked.
- Define injections, name the three, then give their benefits.
- Define leakages, name the three, then give their effects.
- Close with the equilibrium condition — this is the sentence the key is looking for.
The circular flow. The circular flow of income shows how money moves continuously between households and firms, in the direction opposite to the real flow of goods and factor services. Households supply factor services and receive factor payments (Y); they spend that income on goods, and the money returns to firms. The flow would stay constant for ever if households spent their entire income on domestically produced goods. In reality some money leaks out and some is injected in.
INJECTIONS
Export earnings (X), government expenditure (G) and investment (I) are called injections because they do not follow directly from the expenditure of factor payments (Y) — they are additions to the flow from outside the household–firm circuit.
Benefits of injections:
- They raise aggregate demand directly. Every rupee of investment, government spending or export earning is a rupee of demand for domestically produced output.
- They raise income by a multiple through the multiplier. The first round of spending becomes somebody's income; that person spends a part of it, which becomes the next person's income, and so on. National income therefore rises by a multiple of the original injection, the multiplier being 1 ÷ (1 − MPC).
- They raise output and employment. Higher demand makes firms produce more and hire more workers, which is why raising injections is the standard cure for recession.
- Investment also raises future productive capacity. Investment is doubly useful: it adds to demand today and adds to the capital stock, raising the economy's capacity to produce tomorrow.
- Government expenditure can be directed where it is most needed. Spending on infrastructure, education and health raises demand now and productivity later, and can be targeted at backward regions and poorer groups.
- Exports bring in foreign exchange which finances imports of essential raw materials and capital goods and strengthens the balance of payments.
- They lift business confidence. Rising demand improves the expected rate of profit — the marginal efficiency of capital — which induces further private investment.
LEAKAGES
Injections are more or less counter-balanced by withdrawals from the domestic expenditure stream of factor payments. These withdrawals are net savings (S), net taxes (T) and expenditure on foreign goods and services, that is, imports (M).
Effects of leakages:
- They reduce the flow of income. Income that is saved, taxed away or spent abroad does not come back to domestic firms as demand, so the circle shrinks.
- They contract income by a multiple. The multiplier works downwards too, so a leakage causes a multiple contraction in national income, not a one-for-one fall.
- Excess saving causes unemployment. If planned saving exceeds planned investment, aggregate demand is deficient, goods remain unsold, firms cut production and involuntary unemployment appears — the paradox of thrift.
- Heavy taxation reduces disposable income and weakens incentives to work, save and invest.
- High imports worsen the balance of payments. Persistent excess of imports over exports creates a trade deficit, puts downward pressure on the exchange rate and drains foreign exchange reserves.
- They can start a downward spiral. Falling demand lowers profit expectations, which lowers investment, which lowers income again — the mechanism behind the contraction phase of the business cycle.
- But leakages are not simply harmful. Saving is the source from which investment is financed and taxes are the source from which the government finances development. The problem is never their existence but an imbalance between the two sides.
Conclusion. The circular flow of income declines if withdrawals exceed injections and grows if injections exceed withdrawals. When leakages equal injections the flow of income stays at the same level, and that is the equilibrium level of national income. The government's stabilisation task is therefore to manage this balance — raising injections in a recession and restraining them when the economy overheats.
The synoptic is short and is essentially two sentences: the definition of injections as X, G and I that "don't follow directly from the expenditure of factor payments", and the closing rule that "the circular flow of incomes can decline if withdrawals exceed injections or grow if injections exceed withdrawals". That closing sentence is the key marking point — write it explicitly. The key gives no list of benefits or effects at all, but the question asks you to "evaluate" and "elaborate", so the lists above are what actually fills a 10-mark answer.
Revise → Short Notes 07 · Unit 2 · Circular Flow
Final · Q4 — Phases of the Business Cycle 10 marks · Unit 3
"'Any business in economy will not be ever raising and it follows a particular cycle' Explain this statement in the light of various phases of a Business Cycle and elaborate various characteristics of each phase?" — CO2 SO2, BL-Applying, 10 marks
- Agree with the statement and explain why no business can rise for ever (2 marks).
- Draw the diagram — the wavy curve with the four phases labelled and the trend line through it (2 marks). This question is unanswerable at full marks without the figure.
- Take each phase in order with its characteristics (5 marks).
- Conclude with the policy implication (1 mark).
Explaining the statement. The statement is correct. Although free-enterprise economies have grown rapidly over the last two centuries, that growth has never followed a steady and smooth upward path. There is a long-run upward trend in GNP, but around it there are large short-run fluctuations in output, income, employment and prices. No business and no economy can keep rising indefinitely, because expansion eventually runs into the limit of full capacity, costs and prices rise, the expected rate of profit collapses, and the downswing begins. These alternating periods of expansion and contraction are called business cycles or trade cycles. As Keynes put it, a trade cycle is composed of periods of good trade characterised by rising prices and low unemployment, alternating with periods of bad trade characterised by falling prices and high unemployment. Their duration has varied from about two years to ten or twelve years, so they are recurrent though not perfectly regular.
THE PHASES AND THEIR CHARACTERISTICS
1. Recovery / Upturn. This is the phase just after the lowest point of the cycle, when the rate of output just starts to pick up.
- Revival is stimulated when the banking system starts expanding credit again.
- It is also stimulated when investment spurts because capital that was allowed to depreciate without replacement must now be replaced, and because new technology requires new machines.
- Recovery is the turning point from depression into expansion.
2. Expansion / Boom / Prosperity. A period of rising demand, falling unemployment and rising investment. All economic activity is rising; it is a period of growth.
- Both output and employment increase until there is full employment of resources and production is at the highest possible level with the given resources.
- There is no involuntary unemployment — whatever unemployment remains is only frictional and structural.
- The gap between potential GNP and actual GNP becomes zero.
- A good amount of net investment is taking place and demand for durable consumer goods is high.
- Prices generally rise, profits are high, business confidence is strong, and people enjoy a high standard of living.
3. Peak / Peaking out. The upper turning point of the cycle.
- Output growth starts to slow down and the full-capacity level of the economy is nearly reached.
- Because capacity is strained, this is usually accompanied by a rising level of prices. Full employment prevails.
- Something then occurs to end the prosperity. Economists differ on what. Monetarists argue that banks start reducing credit, and this contraction of bank credit causes the downswing. Keynes argued that there is a sudden collapse of the expected rate of profit — the marginal efficiency of capital — caused by an adverse change in entrepreneurs' expectations, which lowers investment and starts the downswing.
4. Slowdown / Contraction / Recession / Depression. A period of falling investment and falling demand for final goods and for factors of production.
- GNP falls and employment is reduced, so involuntary unemployment appears on a large scale.
- Investment decreases, which causes a further fall in consumption — the multiplier working downwards.
- Prices generally fall because aggregate demand is falling.
- A significant feature is the fall in the rate of interest, with which people's demand for money holdings increases.
- There is a great deal of excess capacity — capital-goods and consumer-goods industries work well below capacity. Capital goods and durable consumer goods industries are hit especially hard, because those purchases can be postponed.
- If output falls for six months or more it is called a recession; when the contraction is severe it is called a depression. The depression of 1929–33 is remembered for its great intensity, when US unemployment reached about 25 per cent of the labour force.
5. Trough. The lowest point of the business cycle, which may last for some time.
- Economic activity is at its lowest level, unemployment at its highest, business confidence at its weakest.
- Capital stock is allowed to depreciate without replacement, and progress in technology makes existing capital obsolete.
- Because the market shows no sign of recovering on its own, government intervention is needed — this is precisely the situation Keynes wrote about.
- Once credit expands and replacement investment begins, the economy moves back into recovery and the cycle is complete.
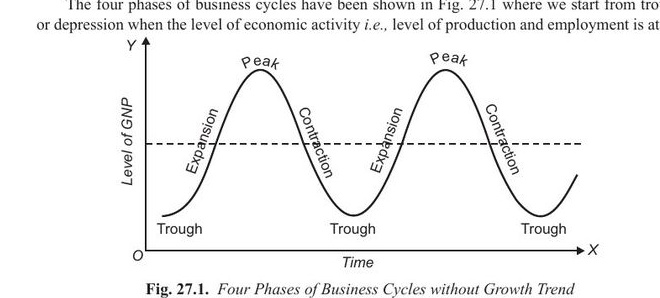
If the trend line is horizontal these are cycles without trend — change without growth. If it slopes upward they are cycles with trend, which Hicks explained by adding autonomous investment arising from population growth and technological progress. Mentioning both versions is worth an extra mark.
Conclusion. Because the cycle is recurrent, no business can expect ever-rising fortunes; it must plan for the downswing as well as the upswing. And because business cycles are very costly — large-scale unemployment, lost output, bankruptcies, human suffering and uncertainty that discourages long-term investment — the government must use counter-cyclical fiscal and monetary policy to reduce the severity of the swings.
The synoptic uses a five-phase naming rather than the textbook's four: (1) Upturn, (2) Expansion, (3) Peaking out, (4) Slowdown or slump, (5) Trough. The answer above deliberately follows the synoptic's five-phase order, because that is what the examiner is ticking against, while giving each phase the textbook's fuller list of characteristics.
Specific phrases from the key worth reproducing: expansion is "a period of rising demand, falling unemployment, rising investment… sometimes called a boom"; at peaking out "the full capacity level of the economy may nearly be reached… accompanied by rising level of prices. Full employment"; "if output falls for 6 months or more it is called a recession"; and at the trough "government intervention is needed". The key also expects a diagram — a blank space is left for it in the paper.
Revise → Short Notes 15 · Unit 3 · Phases of Business Cycles
Final · Q5 — The Phillips Curve and NAIRU 10 marks · Unit 3 · Lec 18
"Graphically explain the curve use to determine relationship between inflation and unemployment. How does this curve behave in long term also known as NAIRU?" — CO1 SO1, BL-Understanding, 10 marks
- Name the curve — Phillips, 1958, UK data — and state the inverse relationship (1 mark).
- Draw the short-run Phillips curve with two labelled points (2 marks).
- Explain why it slopes down and the policy dilemma (2 marks).
- Stagflation — why the stable curve broke down in the 1970s (1 mark).
- Long run: natural rate, adaptive expectations, shifting short-run curves, vertical LPC at NAIRU — draw it (4 marks).
The Phillips curve. The curve used to show the relationship between inflation and unemployment is the Phillips curve, given by the British economist A. W. Phillips in 1958. Using about a hundred years of UK data (1861–1957), he found that the rate of increase of money wages — a proxy for inflation — and the rate of unemployment have an inverse and stable relationship.
Graphical explanation (short run). With the unemployment rate on the X-axis and the inflation rate on the Y-axis, the Phillips curve slopes downward and is convex to the origin. At point A, inflation is 10% and unemployment 3%; if contractionary policy reduces inflation to 5%, unemployment rises to 8% (point B).
- Why it slopes down. As the economy approaches full employment, firms compete for workers and wages rise; employers raise prices to protect profits; real wages do not rise, so workers demand higher money wages again — a wage–price spiral. In Keynesian terms, with an upward-sloping aggregate supply curve, each rise in aggregate demand raises both output (lowering unemployment) and the price level.
- The trade-off and the policy dilemma. Lower unemployment can be bought only with higher inflation, and lower inflation only with higher unemployment. If the government reduces unemployment, inflation rises; if it controls inflation, unemployment rises — so it must choose an optimum combination of the two.
Stagflation. In the 1970s the US and Britain experienced high inflation together with high unemployment and slow growth — stagflation — largely due to the oil-price supply shocks of 1973–74 and 1979–80. This showed that the Phillips curve was not stable: it shifted outward.
Long run — the Phillips curve at NAIRU.
- Natural rate of unemployment. Milton Friedman argued that there is a natural rate of unemployment — consisting of frictional and structural unemployment — at which the number unemployed equals the number of vacancies. It is called NAIRU, the Non-Accelerating Inflation Rate of Unemployment, because at this rate inflation neither accelerates nor decelerates.
- Short-run trade-off. Starting at the natural rate (A₀ — 5% unemployment, 5% inflation, with wages set expecting 5%), an expansionary policy raises inflation to 7%. Money wages are fixed, so real wages fall, profits rise and firms hire more: unemployment falls to 3.5% (A₁).
- Adjustment of expectations. Workers soon realise their real wages have fallen and demand higher money wages. Profits fall back, firms reduce employment, and unemployment returns to the natural rate — but at 7% inflation (B₀). Expected inflation is now 7%, so the short-run Phillips curve shifts up (SPC₁ → SPC₂). Repeating the stimulus moves the economy to B₁ and then C₀ on a still higher curve.
- Vertical long-run curve. Joining A₀, B₀ and C₀ gives a vertical long-run Phillips curve at NAIRU. There is no permanent trade-off between inflation and unemployment: in the long run the economy comes back to its natural rate of unemployment regardless of the inflation rate, and any attempt to keep unemployment below NAIRU only makes inflation accelerate.
- Rational expectations. New classical economists go further: if expectations are rational and wages adjust at once, there is no trade-off even in the short run.
Conclusion. The Phillips curve shows a short-run trade-off between inflation and unemployment, but in the long run the curve is vertical at NAIRU. Demand-management policy can reduce inflation, but it cannot permanently reduce unemployment below its natural rate; that requires supply-side measures that lower frictional and structural unemployment.
The synoptic has four marking points: the curve was given by J. W. [A. W.] Phillips in 1958; it shows an inverse and stable relationship between inflation and unemployment; stagflation — high inflation, slowing growth and steadily high unemployment; and the long-run Phillips curve or NAIRU — no permanent trade-off, with the economy returning to its natural rate of unemployment regardless of inflation. All four are above. What turns them into 10 marks is the two diagrams (the question says "graphically explain") and Friedman's step-by-step expectations argument.
Revise → Short Notes 24 · Unit 3 · Phillips Curve and NAIRU
Final · Q6 — Liquidity Trap and Its Impact on the Economy 10 marks · Unit 4 + Unit 2 IS-LM
"Explain and Illustrate liquidity trap in Monterey [Monetary] policy and its impact on economy with suitable example." — CO3 SO3, BL-Evaluating, 10 marks
- Define liquidity preference and the speculative demand for money (2 marks).
- Define the liquidity trap and draw the LP curve going flat at a very low interest rate (2 marks).
- Explain why monetary policy fails in it (2 marks).
- Impact on the economy (2 marks).
- The example — Japan in the 1990s — and the way out through fiscal policy (2 marks).
Background — liquidity preference. Keynes used the term liquidity preference for the demand to hold money. People hold money for three motives: the transactions motive (to bridge the gap between receiving income and spending it), the precautionary motive (for unforeseen contingencies), and the speculative motive (to take advantage of expected changes in the rate of interest and bond prices). The speculative demand for money is a decreasing function of the rate of interest: at a high rate of interest people lend or buy bonds and hold little idle cash, while at a low rate of interest they hold more cash, because little is lost by not lending.
Definition of the liquidity trap. At a very low rate of interest, the liquidity preference curve becomes perfectly elastic — a horizontal straight line. This portion, where liquidity preference is absolute, is called the liquidity trap. In it people will hold as idle balances any amount of money that comes to them, because the rate of interest is already so low that they expect it can only rise (and bond prices can only fall), so holding cash is preferable to holding bonds.
Why monetary policy becomes ineffective.
- Any expansion in the money supply gets "trapped" in the sphere of the liquidity trap — the new money is simply absorbed into idle speculative balances instead of being lent or spent.
- Therefore the increase in money supply cannot reduce the rate of interest any further.
- Since the interest rate does not fall, investment is not stimulated, and aggregate demand does not rise.
- In IS–LM terms, the LM curve is horizontal in this range. Shifting the LM curve rightward by increasing money supply produces no change at all in income or in the interest rate. Monetary policy is powerless; fiscal policy, by contrast, is fully effective with no crowding out, because the interest rate does not rise when the IS curve shifts right.
- Keynes concluded from exactly this that monetary policy becomes ineffective in tiding over an economic depression, and that fiscal policy must do the work instead.
- A second, reinforcing reason is that in a depression investment demand is not very sensitive to the interest rate, because it depends mainly on the marginal efficiency of capital and on business confidence, both of which have collapsed. As the saying goes, "you can bring the horse to water but you cannot make it drink."
Impact on the economy.
- Households and businesses prefer holding cash to investing, no matter how much the money supply is increased.
- Nominal interest rates are near zero while savings rates remain high, so the money does not circulate.
- The economy faces stagnation — low or negative growth with idle capacity.
- High unemployment persists because aggregate demand does not recover.
- Growth remains subdued and the slump becomes prolonged, since the usual monetary remedy has been exhausted.
- There is a risk of deflation, which makes the trap worse: falling prices raise the real rate of interest even when the nominal rate is zero, which discourages borrowing further.
Example — Japan in the 1990s. The classic example is Japan during the 1990s, often called its "lost decade". After the collapse of its asset-price bubble, the Bank of Japan cut interest rates effectively to zero and expanded the money supply repeatedly, yet persistent deflation and near-zero interest rates failed to revive consumption and investment. Households and firms preferred to hold cash and repay debt, so the extra money simply sat idle. The economy remained stagnant despite an extremely easy monetary policy. A comparable situation appeared in the United States and Europe after the 2008 global financial crisis, when policy rates were cut to near zero and central banks still had to resort to unconventional measures.
The way out. When monetary intervention is not sufficient to break the trap, the government must rely on expansionary fiscal policy — increased public spending on infrastructure and public works, and tax cuts — to raise aggregate demand directly. This is precisely why Keynes argued that fiscal policy, not monetary policy, is the effective weapon against a deep depression, and it is the strongest practical argument in the whole fiscal-versus-monetary debate.
The synoptic gives one paragraph: very low nominal interest rates with high savings rates make monetary policy ineffective; households and businesses prefer holding cash regardless of increases in money supply; Japan in the 1990s is the classic example, with persistent deflation and zero interest rates failing to revive consumption and investment; the result is stagnation, high unemployment and subdued growth; and the government may need expansionary fiscal policy such as increased public spending or tax cuts. Every one of those elements appears above. What the key does not supply — and what makes the difference at 10 marks — is the liquidity preference foundation, the diagram, and the IS–LM explanation. The question says "Illustrate", so the flat LP curve or the horizontal LM range must be drawn.
Revise → Short Notes 29 · 13 · Unit 4 · Liquidity Trap (with diagram) · Unit 2 · IS-LM
Final · Q7 — Corporate Social Responsibility of Business 10 marks · Unit 5 · Lec 29
"The objectives of business corporation should not always be inclined towards profit maximization but they also have their social responsibilities towards various section of society. Highlight and explain various Corporate Social Responsibility CSR businesses have towards society?" — CO2 SO2, BL-Applying, 10 marks
- Meaning and definition of CSR; why profit alone is not enough (1.5 marks).
- Responsibilities towards each section of society — shareholders, employees, consumers, government, society — this is the marking scheme (6 marks).
- Arguments for and against, briefly (1 mark).
- Indian position: examples and Section 135 of the Companies Act, 2013 (1.5 marks).
Meaning. Corporate social responsibility (CSR) is, in Koontz's words, "a serious consideration, by the corporate sector, of the impact of its actions on society". According to Bowen, it refers to the obligation of businessmen to pursue those policies and decisions that are desirable in terms of the objectives and values of society. The idea took root in the 1930s, when it was accepted that managers of large companies must keep an equitable balance among the interests of shareholders, employees, customers, suppliers and the public.
Why profit is not the only objective. Private business functions by public consent; it uses society's resources and affects many groups. If it fails to meet the aspirations of society, it loses that consent and invites tighter government control. Social responsibility is therefore also in business's own long-run interest.
Social responsibilities towards various sections of society:
- Towards shareholders: (i) a reasonable rate of return over time; (ii) the survival and growth of the company; (iii) building the company's reputation and goodwill.
- Towards employees: (i) fair wages, paid regularly; (ii) good, safe working conditions; (iii) reasonable work standards; (iv) welfare services — health, education, recreation and housing; (v) training and promotion; (vi) recognition of and respect for hard work, efficiency, honesty, sincerity and loyalty; (vii) efficient and effective redressal of grievances.
- Towards customers: (i) goods and services at reasonable prices; (ii) promised quality, durability and service; (iii) socially harmless products; (iv) an efficient customer-redressal mechanism; (v) avoiding unnecessary middlemen; (vi) resisting profiteering and black-marketing; (vii) continuous innovation and improvement of product quality through research and development.
- Towards the government: (i) regular payment of taxes; (ii) abiding by laws and regulations; (iii) resisting bribery of officials and ministers; (iv) not taking advantage of loopholes in business laws; (v) co-operating with the government in research and development and in upgrading the environment; (vi) co-operating with the government in promoting social values.
- Towards society as a whole: (i) prevention of environmental pollution; (ii) preservation of ethical and moral values; (iii) provision of health, education and cultural services; (iv) minimising ecological imbalance; (v) choosing appropriate technology.
- Towards trade unions: recognising them and settling disputes through consultation and collective bargaining.
The debate. Arguments in favour: business takes from society and must give back ("give and take"); a better society is a better environment for business; voluntary responsibility reduces state intervention; authority must go with responsibility. Against: Milton Friedman held that the only social responsibility of business is to increase its profits within the rules of the game; CSR raises costs, may hurt competitiveness, and managers lack the mandate and accountability. Yet even Friedman and Baumol accept that business must refrain from anti-social practices such as adulteration, black-marketing, exploitation of labour and pollution.
Indian position. Pioneers such as Tata Steel (environmental conservation, education, vocational training and health care) and L&T (family planning, TB camps, dairy and poultry development) have long practised CSR. Since 2014, Section 135 of the Companies Act, 2013 requires every company with a net worth of ₹500 crore or more, turnover of ₹1,000 crore or more, or net profit of ₹5 crore or more to spend at least 2% of its average net profit of the preceding three years on CSR activities such as poverty eradication, education, health and environmental sustainability. Thus the modern objective of business is not profit maximisation alone, but profit with social responsibility.
The synoptic is a pure list by stakeholder: towards employees (recognition and respect for hard work, efficiency, honesty, sincerity and loyalty; redressal of grievances), towards customers (reasonable price; promised quality and durability; redressal mechanism; resisting black-marketing; innovation through R&D), towards government (regular taxes; abiding by laws; avoiding loopholes; co-operating in promoting social values) and towards society (preventing pollution; ethical and moral duties; health, education and cultural services). Every one of those phrases is in bold above. The key leaves out shareholders, the definition and the Indian law — adding them is what separates a list from a 10-mark answer.
Revise → Short Notes 33 · Unit 5 · Social Responsibility of Business
Re-Exam · Q1(a) — Ways the Government Influences the Economy 2.5 marks · Unit 1
"Mention two important ways in which the government influences the overall economy." — CO1 SO1, BL-Understand, 2.5 marks
The question says "two", so lead with the two stabilisation policies and explain them properly. Then add the other roles as a short list — the official key itself lists five, so a bare two-line answer would under-score.
The government influences the overall economy mainly through its stabilisation policy, which has two arms:
- Fiscal policy — taxation and government expenditure. In a recession the government adopts an expansionary fiscal policy: it increases its expenditure and reduces taxes, running a deficit budget to raise aggregate demand, income and employment. Against high inflation it does the reverse, cutting expenditure and raising taxes to make a surplus budget and take purchasing power out of the system.
- Monetary policy — money supply, credit and interest rates. Operated through the central bank, it uses the repo rate, open market operations, the cash reserve ratio and the statutory liquidity ratio. To fight recession it adopts an easy money policy — lower rates, more credit; to fight inflation it adopts a tight money policy — higher rates, less credit.
Besides stabilisation, the government also influences the economy through:
- Allocation of resources — it provides public goods such as defence, roads and law and order that the market will not supply, and corrects the market where private and social costs differ.
- Income redistribution — through progressive taxes on the rich and transfer payments, subsidies and welfare spending on the poor.
- Promotion of economic growth — through public investment in infrastructure, education and health, which raises the country's productive capacity.
- Regulation — through laws and regulatory bodies that control monopoly, protect consumers and workers and keep the financial system sound.
A qualification worth adding: government borrowing to finance a deficit raises the rate of interest and can crowd out private investment, and financing a deficit by printing money can cause inflation.
The synoptic lists five headings: (1) Stabilization Policy — Fiscal Policy and Monetary Policy, (2) Allocation of Resources, (3) Income Redistribution, (4) Economic Growth, (5) Regulation. Even though the question asks for "two", the key rewards the fuller list — so give all five, with the two stabilisation arms explained and the rest named.
Revise → Short Notes 05 · Unit 1 · Role of Government
Re-Exam · Q1(b) — National Income Accounting and Its Importance 2.5 marks · Unit 2
"Define National Income Accounting? Highlights its importance in the economy" — CO2 SO2, BL-Understand, 2.5 marks
Definition. National income accounting is a set of systematic statistical statements which reflects the value of the total final output produced in the various sectors of an economy, together with details of the distribution of factor incomes among different groups and the final expenditure of the economy. In short, it is the accounting system of the whole country, and it rests on Hicks' identity that national product = national income = national expenditure — three ways of measuring the same total, at production, at distribution and at spending.
Its importance:
- It helps us understand the complexity of economic transactions in the economy and the structure of its different sectors.
- It captures the major economic flows and relationships between the various parts of the economy — production, income and expenditure.
- It provides a simplified framework in which those interrelationships can be studied.
- It provides the basis for policy evaluation — no policy can be judged without measuring what happened to income, consumption and investment.
- It provides the framework for long-term policy decisions and economic planning, since plan targets for growth, saving and investment are set in national income terms.
- It permits comparison over time and across countries, and per-capita income gives a rough indication of the standard of living.
The main aggregates it produces are GDP, GNP, NNP, National Income (NNP at factor cost), Personal Income and Personal Disposable Income.
The synoptic's definition is quoted almost word for word above — use that exact phrasing, it is clearly the marking sentence. Its five importance points are also reproduced above in the same order. Adding Hicks' identity and naming the aggregates rounds the answer out to 2.5 marks.
Revise → Short Notes 08 · Unit 2 · National Income
Re-Exam · Q1(c) — Two Major Types of Inflation 2.5 marks · Unit 3 · Lec 17
"What are the two major types of Inflation in the economy?" — CO2 SO1, BL-Remember, 2.5 marks
Name both, define each in terms of the AD–AS diagram (which is in your portion), give a cause and an example for each, and finish with the one difference that matters — what each does to output.
Inflation means a persistent rise in the general price level. Depending on what causes it, the two major types are demand-pull inflation and cost-push inflation.
1. Demand-pull inflation. This occurs when aggregate demand for goods and services exceeds the available supply of output at existing prices — a demand shock. A rightward shift of the aggregate demand curve pushes prices up. When demand is pushed up, prices move faster and inflation results.
- Keynes explained it through the inflationary gap — the excess of aggregate demand over full-employment output.
- Typical causes: an increase in government expenditure not matched by taxes (deficit financing), a rise in private investment, or an excessive growth of the money supply.
- Because it is the theory of excess demand, demand-pull inflation is associated with the name of Keynes.
2. Cost-push inflation. This occurs when producers raise prices for reasons other than strong demand — because their costs of production have risen — a supply shock. An inward (leftward) shift of the aggregate supply curve raises the price level even though aggregate demand is unchanged. It is also called supply-side inflation.
- Typical causes: an oil price shock, a farm price shock from a poor monsoon, an import price shock when the rupee depreciates, and wage-push pressure from strong trade unions.
The key difference. Demand-pull inflation raises the price level and raises output. Cost-push inflation raises the price level but reduces output and employment — this combination of high inflation with falling output is called stagflation. (A third type, structuralist inflation, is sometimes added to explain inflation in developing countries, where infrastructural bottlenecks in power, transport and fuel hold back supply.)
The synoptic names exactly these two and describes them in curve-shift terms: for demand-pull, "shift in demand curve leads to increase in prices; when demand is pushed up prices move faster causing inflation"; for cost-push, "producers increase prices of goods for reasons other than strong demand; an inward shift of the aggregate supply curve leads the cost to increase hence inflation increases." Since the key is framed in AD–AS language, draw the two shifts — that diagram is squarely inside your Unit 2 portion.
Revise → Short Notes 21 · Unit 3 · Demand-Pull and Cost-Push (both diagrams) · Unit 2 · AD-AS
Re-Exam · Q1(d) — Money and Money Supply 2.5 marks · Unit 4 · Lec 21–22
"Define Money and money supply in the economy?" — CO3 SO3, BL-Applying, 2.5 marks
Two definitions, each followed by two or three supporting lines: money by its functions; money supply by what it includes and excludes, with the M1–M4 measures named.
Money. Money is anything that is generally acceptable as a means of payment. According to Crowther, "money can be anything that is generally acceptable as a means of exchange and that at the same time acts as a measure and a store of value"; Walker put it simply: "money is what money does". Money is thus defined by its functions — it serves as a medium of exchange (means of payment), a measure of value (unit of account), a store of value (a way of holding wealth) and a standard of deferred payments.
Money supply. Money supply is the total stock of money held by the public in spendable form at a given point of time. It consists of currency with the public (notes and coins) and demand deposits with banks, together with other easily accessible deposits. It excludes money held by the RBI, the government and the banks themselves, since they are money-creating agencies. The RBI measures it as M1 (C + DD + OD, narrow money), M2, M3 (M1 + time deposits, broad money) and M4.
Money supply is determined by the RBI's high-powered money and the money multiplier, and it influences interest rates, inflation and the overall level of economic activity.
Money as a means of payment (medium of exchange), means of evaluation (unit of account) and means of storing wealth; money supply as the total stock of currency and liquid instruments available at a given time — cash, demand deposits and other easily accessible funds — which influences interest rates, inflation and economic activity. Naming M1 and M3 is an easy extra.
Revise → Short Notes 28 · Unit 4 · Money · Supply of Money
Re-Exam · Q2 — Unemployment, Inflation and Growth, and How Government Manages Them 10 marks · Unit 1 + Unit 3
"Identify and explain the main economic problems like unemployment, inflation, and growth in macroeconomics. Explain and Clarify how the government tries to manage these issues in the economy" — CO2 SO2, BL-Applying, 10 marks
- Part A (about 5 marks): the three problems, one block each, with causes and consequences.
- Part B (about 5 marks): the government's remedies — fiscal policy, monetary policy, and development programmes.
- Link the two halves with a sentence saying the three problems are interconnected. The key explicitly rewards that.
PART A — THE THREE MAIN MACROECONOMIC PROBLEMS
1. Unemployment. Unemployment occurs when people who are willing and able to work at the prevailing wage cannot find jobs, which means a loss of income to them and a loss of production to the country.
- Keynes explained that with aggregate supply fixed in the short run, it is a deficiency of aggregate demand that causes involuntary unemployment, so the economy can settle in equilibrium below full employment.
- Changes in private investment cause the fluctuations in aggregate demand responsible for cyclical unemployment.
- Its costs are both economic and social — output that could have been produced is permanently lost, and unemployment causes misery, poverty and social disturbance.
2. Inflation. Inflation is a sustained rise in the general price level, which reduces the purchasing power of money.
- Classical economists held that the price level is determined by the quantity of money. Keynes argued that just as unemployment is caused by a deficiency of aggregate demand, inflation is caused by excessive aggregate demand — the demand-pull theory. Cost-push inflation, caused by supply shocks such as an oil price rise, was recognised later.
- Its effects: it erodes real incomes, hits fixed-income groups and the poor hardest, redistributes income towards debtors and businessmen, distorts relative prices and misallocates resources, creates uncertainty, discourages saving and worsens the balance of payments.
3. Economic growth. Economic growth means a sustained increase in a nation's real output and income over a long period, usually measured by the growth of real GDP or per-capita income.
- It depends on the growth of physical capital, human capital and technological progress, and therefore on the rates of saving and investment.
- Slow growth means poverty and unemployment persist, which is why growth is the central problem of developing countries such as India.
These issues are interconnected. Too much inflation slows growth by discouraging saving and diverting funds into unproductive assets; low aggregate demand causes unemployment; and rapid growth pursued too hard can generate inflation. There is a short-run trade-off between them, so policy must strike a balance rather than pursue any one goal alone.
PART B — HOW THE GOVERNMENT MANAGES THEM
1. Fiscal policy. By changing taxes and public spending the government manages aggregate demand.
- Against unemployment and recession it adopts an expansionary policy — it increases expenditure and cuts taxes, running a deficit budget. Higher spending works directly on the incomes of suppliers and workers and indirectly through the multiplier, raising income and employment by a multiple of the original injection.
- Against inflation it reduces expenditure and raises taxes, aiming at a surplus budget that takes purchasing power out of the economy.
- Automatic or built-in stabilisers work without any new decision: progressive income tax, corporate tax, transfer payments such as unemployment compensation, and stable corporate dividend policy all cushion the swings. They reduce fluctuations, but by only about one-third, so discretionary action is still needed.
2. Monetary policy. The central bank controls interest rates and the money supply to stabilise prices and promote growth.
- Against inflation — a tight money policy: raise the repo rate and bank rate, raise the CRR and SLR, and sell government securities in the open market. Credit becomes costly and scarce and demand falls.
- Against recession and unemployment — an easy money policy: lower the policy rates, lower the CRR and SLR, and buy securities. Credit becomes cheap and plentiful and investment revives.
- Selective credit controls steer credit away from speculative hoarding and towards priority sectors such as agriculture and small industry.
3. Development programmes and supply-side measures.
- Investment in infrastructure, education and health raises productivity and long-term growth, and raises demand and employment in the short run at the same time.
- Supply-side policies — reducing taxes to strengthen the incentive to work, save and invest — raise aggregate supply so that output rises and prices fall together. This approach was adopted when the industrial countries faced stagflation in the 1970s, which demand management alone could not cure.
- Employment guarantee schemes, rural public works and anti-poverty programmes attack unemployment and poverty directly.
Conclusion. Through these measures the government maintains economic stability, ensures employment and fosters balanced economic development. But the policies have limits — fiscal policy suffers from crowding out and long time lags, and monetary policy can be powerless in a liquidity trap. The two must therefore be coordinated: a tight monetary policy cannot control inflation on its own if the government is simultaneously running a large fiscal deficit that keeps adding to aggregate demand.
The synoptic defines the three problems in one line each, states that they are interconnected ("too much inflation may slow growth, while low demand may cause unemployment"), and then lists the government's role under exactly three headings — Fiscal Policy, Monetary Policy, Development Programs — closing with "the government maintains stability, ensures employment, and fosters balanced economic development". Those three headings and that closing sentence are the marking skeleton, and the answer above is built on them. The synoptic's own content is roughly a page for a 10-mark question, so the detail under each heading is what earns the rest of the marks.
Revise → Short Notes 03 · Short Notes 19 · Unit 1 · Unit 3
Re-Exam · Q3 — Goods and Money Market Equilibrium; Shifts in IS and LM 10 marks · Unit 2
"Discuss about money market and goods market equilibrium and its benefits to economy? What causes Shift in liquidity preference and investment saving in an economy?" — CO3 SO2, BL-Applying, 10 marks
"Investment saving" means the IS curve and "liquidity preference" means the LM curve. So the question is: explain IS–LM equilibrium, say why it is useful, then explain what shifts each curve and what happens when it does. Draw the diagram — the answer cannot score full marks without it.
The IS–LM model. Developed by J. R. Hicks and extended by Hansen, the IS–LM model brings the goods market and the money market into a single framework.
- The IS curve (Investment = Saving) is the goods-market curve. Every point on it is a combination of income and interest rate at which planned investment equals planned saving, that is, at which the goods market is in equilibrium. It slopes downward, because a lower rate of interest raises investment, which through the multiplier raises income.
- The LM curve (Liquidity preference = Money supply) is the money-market curve. Every point on it is a combination at which the demand for money equals the supply of money. It slopes upward, because a higher income raises the transactions demand for money, and with money supply fixed the rate of interest must rise to keep the market in balance.
- The point where the IS and LM curves intersect is the point of general equilibrium — the point at which the market is balanced. It determines the equilibrium level of national income and the equilibrium rate of interest simultaneously. At any other point at least one of the two markets is out of equilibrium, and forces are set up that push the economy back towards the intersection.
Benefits of the model to the economy and to policy:
- It shows that income and the rate of interest are determined together, by real factors and monetary factors acting jointly — Hicks and Hansen thereby reconciled the Keynesian and classical theories of interest.
- It shows the effect of fiscal policy: expansion shifts IS to the right, so income rises and the interest rate rises, and the higher rate reduces private investment — partial crowding out.
- It shows the effect of monetary policy: expansion shifts LM to the right, so the interest rate falls and income rises, with no crowding out.
- It tells the government which policy will work in which situation, through the three ranges of the LM curve (below).
- It gives a single diagram in which the goods market and money market can be analysed together instead of separately, which makes it the standard tool of short-run macroeconomic policy analysis.
WHAT SHIFTS THE IS CURVE (investment–saving)
- A rise in autonomous spending, especially government expenditure (G), shifts the IS curve rightward.
- A rise in autonomous investment or an improvement in business expectations (a higher marginal efficiency of capital) shifts it rightward.
- A cut in taxes raises disposable income and consumption and shifts it rightward.
- A fall in the desire to save (a higher MPC) makes the multiplier larger and shifts it rightward and makes it flatter.
- Result: with the LM curve fixed, a rightward shift of IS raises both the rate of interest and GDP.
- Reductions in G, in autonomous investment, or a rise in taxes shift IS leftward, lowering both income and the interest rate.
WHAT SHIFTS THE LM CURVE (liquidity preference)
- The real money supply is what shifts the LM curve. An increase in the real money supply — either because the central bank increases the nominal money supply, or because the price level falls — shifts LM rightward.
- A rightward shift of LM means a lower rate of interest at every level of income.
- Result: with the IS curve fixed, a rightward shift of LM makes the interest rate fall and output rise.
- A change in liquidity preference itself also shifts the curve: if people's desire to hold money increases — for example because they expect interest rates to rise in future, or because uncertainty increases — the whole liquidity preference curve shifts and LM shifts leftward, raising the interest rate.
- A contraction of the money supply, or a rise in the price level, shifts LM leftward, raising the interest rate and lowering income.
The three ranges of the LM curve — add this for full marks
- Keynesian or liquidity-trap range — LM is horizontal at a very low interest rate. Monetary policy is completely ineffective; fiscal policy is fully effective with no crowding out.
- Intermediate range — LM slopes upward. Both policies work; fiscal policy causes partial crowding out.
- Classical range — LM is vertical. Fiscal policy is completely crowded out; monetary policy is fully effective.
Conclusion. The intersection of IS and LM is the point at which the goods market and the money market are simultaneously in equilibrium, and it is the position the economy tends towards. Because fiscal policy moves the IS curve and monetary policy moves the LM curve, the model lets the government see in advance what each policy will do to income and to the rate of interest — which is exactly why it remains the standard framework for short-run stabilisation policy.
The synoptic is written in note form and is quite compressed, but its marking points are clear: "the point at where IS-LM curve meet is the point of equilibrium, thus this is the point where the market is balanced"; for the IS shift, autonomous spending including government spending → IS shifts rightward → both interest rate and GDP rise; for the LM shift, real money supply is responsible → higher real money supply lowers the interest rate → LM shifts rightward → interest rate falls and output rises. Those two shift-and-result pairs are the core of the marks. The key leaves a blank space for a diagram, so draw the IS–LM cross with both shifts marked.
Revise → Short Notes 13 · Unit 2 · IS-LM Model
Re-Exam · Q4 — The Two Policies for Economic Stabilisation 10 marks · Unit 3
"Government uses two major policies for economic stabilization, what two major policies are applied by government for growth and stabilization of economy? Elaborate their major implications in an economy?" — CO2 SO2, BL-Applying, 10 marks
Name the two → explain each briefly → then give the four combinations, which is what "elaborate their major implications" means: expansionary monetary, contractionary monetary, expansionary fiscal, contractionary fiscal. The official key is organised exactly that way, so follow it.
The two major tools used by the government for economic stabilisation are fiscal policy and monetary policy.
- Fiscal Policy. The government adjusts its spending and taxation to manage aggregate demand and the level of employment.
- Monetary Policy. The central bank regulates the money supply and interest rates to control inflation and promote stable growth.
Both policies aim to maintain economic stability and encourage sustainable development. Each has an expansionary and a contractionary form, used in opposite economic conditions.
1. EXPANSIONARY MONETARY POLICY — generally implemented during an economic slowdown or recession, to revive the economy.
- The central bank lowers the rate of interest. It also lowers the CRR and SLR and buys government securities in the open market.
- With low interest rates it is unattractive for people to save, so they start spending money.
- People and firms take loans because interest rates are low and spend the money on productive activities.
- This increases the money supply in the market, raises aggregate demand, and the economy can thrive again.
- Example: after the 2008 global financial crisis, the Reserve Bank of India cut the repo rate from about 9 per cent in July 2008 to 4.75 per cent by March 2009 to revive private investment and prevent a sharp slowdown.
2. CONTRACTIONARY (TIGHT) MONETARY POLICY — generally implemented during high inflation, when the RBI wants to curb the money circulating in the economy.
- The central bank raises the rate of interest, raises the CRR and SLR, and sells government securities.
- When interest rates are high, people and firms spend less and borrow less.
- Spending is curbed and the money supply decreases, so the needed slowdown is achieved in the market and the pressure on prices eases.
- Higher deposit rates also encourage households to save rather than consume.
3. EXPANSIONARY FISCAL POLICY — used during a recession.
- Lower taxes — which raises households' disposable income and firms' retained profits.
- Increase government spending — on public works, infrastructure, education and health.
- The result is a deficit budget. Government spending works directly on the incomes of suppliers and workers, and indirectly through the multiplier, so national income rises by a multiple of the original increase.
4. CONTRACTIONARY FISCAL POLICY — used during mounting inflation.
- Increase taxes — which reduces disposable income and private spending.
- Lower government spending — which reduces demand directly.
- The result is a surplus budget that withdraws purchasing power from the economy.
MAJOR IMPLICATIONS — add these for the top marks
- Automatic stabilisers mean fiscal policy works partly on its own: progressive income tax, corporate tax, transfer payments and stable dividend policy all cushion the cycle without any new decision. But they reduce fluctuations by only about a third.
- Crowding out. A fiscal deficit financed by borrowing raises the rate of interest and squeezes private investment, so the net expansionary effect is smaller than intended.
- Time lags. Fiscal policy is slow — the budget is annual and needs legislative approval — whereas monetary policy can be changed at any time in the year. This speed is monetary policy's main practical advantage.
- The liquidity trap. In a deep depression monetary policy can become powerless, because extra money is simply held as idle balances and the interest rate cannot fall further. Keynes concluded that fiscal policy must then do the work: you can bring the horse to water but you cannot make it drink.
- Inflation risk. If a deficit is financed by printing money rather than by borrowing, it adds directly to money supply and can itself cause inflation.
- Coordination is essential. A tight monetary policy cannot control inflation on its own if the government is simultaneously running a large fiscal deficit. The RBI has made exactly this criticism of Indian fiscal policy — unless the fiscal deficit is brought down, tight money alone will not check inflation.
Conclusion. Fiscal policy and monetary policy are the two arms of stabilisation policy. Used counter-cyclically — expansionary in a slump, contractionary in a boom — and used in coordination with each other, they moderate the severity of the business cycle, keep prices stable and create the conditions for sustained growth.
The synoptic names the two policies, then sets out precisely the four combinations reproduced above, in this order: expansionary monetary (with the 2008 recession named as the example), contractionary monetary, expansionary fiscal (lower taxes, increase government spending), and contractionary fiscal (increase taxes, lower government spending). Reproduce that four-block structure — it is the marking scheme. The key stops there, so the implications section above is what carries the answer from a pass to full marks.
Revise → Short Notes 19 · Short Notes 17–18 · Unit 3
Re-Exam · Q5 — Causes and Effects of Inflation; the Government's Role in an LDC 10 marks · Unit 3 · Lec 17–18
"What are the major causes and effect of high inflation in an economy? What role does government play in fighting inflation especially in less developed country?" — CO1 SO1, BL-Understanding, 10 marks
- Define inflation (0.5 mark).
- Causes — demand-pull and cost-push lists, with the two AD–AS shifts sketched (3.5 marks).
- Effects (2.5 marks).
- Government's role — monetary, fiscal, direct and supply-side measures, with the LDC-specific points (3.5 marks).
Meaning. Inflation is a persistent and appreciable rise in the general price level, which means a continuous fall in the value of money.
A. Causes of inflation
(i) Demand-pull causes — aggregate demand exceeds aggregate supply, shifting the AD curve to the right:
- Increase in public expenditure, especially when financed by deficit financing (borrowing from the central bank).
- Increase in private expenditure on consumption and investment, fed by bank credit creation.
- Increase in exports, which reduces domestic supply while raising incomes.
- Reduction in taxation and repayment of public debt, which raise disposable income.
- Increase in money supply and black money.
- Rapid growth of population, raising demand for essentials.
(ii) Cost-push causes — rising costs shift the AS curve to the left, raising prices and reducing output (stagflation):
- Higher oil prices and rising prices of raw materials.
- Natural disasters — drought, floods, tsunami — which cut farm output and cause food inflation.
- Supply disruptions such as a lockdown, and natural or artificial scarcity (hoarding).
- Wage increases beyond productivity, higher profit margins, and import-price rises due to currency depreciation.
B. Effects of high inflation — inflation has distortionary effects on the economy:
- It affects the allocation of resources, distorting relative prices and diverting saving into gold and real estate.
- It erodes the purchasing power of money and the real income of fixed-income groups, pensioners and the poor.
- It erodes wealth held in money, deposits and bonds, and redistributes income from creditors to debtors and from wage-earners to businessmen.
- It creates uncertainty about incomes and returns, discouraging saving and long-term investment and slowing growth.
- It worsens the balance of payments by reducing exports and raising imports, and causes social and political discontent.
C. The government's role in fighting inflation
- Monetary measures (through the central bank): variable reserve ratios — raising the CRR and SLR; open market operations — selling securities; raising the bank rate and repo rate; and selective credit controls against hoarding of sensitive commodities.
- Fiscal measures: cutting down government expenditure, especially unproductive spending; raising taxation and checking tax evasion; reducing the fiscal deficit and deficit financing.
- Direct measures: price controls on essentials, rationing through the Public Distribution System, and limits on wages, profits and dividends.
- Indexation — indexation of wages (dearness allowance) and of other incomes to protect real incomes from inflation.
D. Especially in a less developed country — inflation there is largely structural: agricultural bottlenecks, infrastructure shortages, foreign-exchange constraints, deficit-financed development and high propensities to consume. Monetary tools are weaker because money markets are underdeveloped and the tax base is narrow. So the government must, in addition:
- raise agricultural productivity (irrigation, technology, land reform) and build power, transport and fuel infrastructure;
- keep buffer stocks and run an efficient PDS; import goods in short supply and ban exports of scarce essentials;
- widen the tax base, curb black money and limit deficit financing to productive uses.
Conclusion. Since inflation in less developed countries comes from both demand and structural supply factors, the government must combine demand restraint with measures that expand supply — monetary policy alone cannot do the job.
The synoptic lists causes — increase in public expenditure, increase in private expenditure, increase in exports, reduction in taxation, repayment of public debt, rapid population growth, natural disaster, drought, higher oil price, tsunami or lockdown causing disruption in supply; effects — distortionary effects, allocation of resources, erosion of purchasing power, erosion of wealth, uncertainty about incomes and returns; and the government's role — variable reserve ratio, open market operations, cutting government expenditure, taxation, indexation, indexation of wages. All are in bold above. The key says nothing specific about LDCs — the structuralist section D is what actually answers the second half of the question.
Revise → Short Notes 21–23 · Unit 3 · Causes · Control · Inflation in LDCs
Re-Exam · Q6 — The Central Bank in Sustainable Development; Lender of the Last Resort 10 marks · Unit 4 · Lec 19–20
"Highlight the role of central bank in sustainable development of an economy. Why central banks are also known as Lender of last Resort." — CO3 SO3, BL-Evaluating, 10 marks
- Central bank — one-line definition (RBI) and its regulatory + promotional role (1 mark).
- Role in development: savings, investment, allocation, price stability, institutions (4 marks).
- The "sustainable" layer: stability, supervision, inclusion, digital payments, green and priority credit, advice to government (2 marks).
- Lender of the last resort — the fractional-reserve reasoning (3 marks).
Introduction. The central bank — the Reserve Bank of India in India — is the apex monetary institution. In a developing country it plays not only a regulatory role (currency, credit, banks) but also a promotional role in development. Growth requires higher saving, its mobilisation, higher investment and its allocation to productive uses; sustainable development further requires that growth be stable, inclusive and environmentally responsible.
A. Role in sustainable development
- Macroeconomic stability. By controlling inflation and keeping interest rates stable, the central bank creates the confidence needed for saving, investment and long-term planning. Price stability also protects the poor.
- Mobilising savings. By maintaining a positive real rate of interest and promoting branch expansion into rural and under-banked areas (bank offices in India rose from about 8,000 in 1969 to over 62,000 by 1995), it draws savings into the formal financial system.
- Credit for investment. Through an easy-money policy when needed (for example, cutting the repo rate from 9% to 4.75% after the 2008 crisis) and adequate availability of credit, it stimulates private investment; through the SLR, banks finance public investment in infrastructure.
- Directing credit flows. Through priority-sector lending and selective credit controls it channels credit to agriculture, small industry, exports, and sectors such as green energy and infrastructure, and away from speculation and hoarding.
- Supervision and regulation. It supervises banks and financial institutions, ensuring a sound financial system and acting as a guardian against financial crises.
- Financial inclusion and digital payments. It promotes banking access for the unbanked and develops digital payment systems, making growth more equitable.
- Building institutions. It helped establish specialised institutions for industrial finance, agricultural credit and export credit.
- Exchange-rate stability and adviser to the government on economic and financial policy.
B. Why the central bank is called the lender of the last resort
- Commercial banks work on a fractional reserve system: they keep only a small part of deposits in cash and lend the rest.
- So even a well-managed bank cannot meet a sudden, large demand for cash — a bank run — when depositors panic.
- At such a time other banks refuse to lend and there is no other source of funds. The central bank then steps in and provides emergency loans against approved securities or by rediscounting bills.
- Because it lends when every other source has failed, it is the last resort. This prevents bank failures from spreading, protects depositors, and maintains public trust in the financial system — itself a foundation of sustainable development.
Conclusion. Through its regulatory and promotional functions, and as the lender of the last resort, the central bank lays the foundation for stable, inclusive and sustainable economic progress.
The synoptic: the central bank supports sustainable development through regulatory and policy functions — controlling inflation, supervising financial institutions, ensuring stable interest rates, promoting financial inclusion, directing credit to priority sectors like green energy or infrastructure, fostering digital payment systems, advising the government, and guarding against financial crises; and it is the lender of last resort because it provides emergency loans to institutions facing liquidity shortages, preventing bank failures and maintaining trust. The textbook growth channels (savings, investment, allocation) are the extra that fills a 10-mark answer.
Revise → Short Notes 27 · Unit 4 · Role in Development · Functions
Re-Exam · Q7 — Industrial Policies of the Government of India 10 marks · Unit 5 · Lec 28
"'A sound industry policy determine nature, scope, prospects of industrial growth in a nation' elaborate this statement by explaining various industry policies implemented by government in india?" — CO2 SO2, BL-Applying, 10 marks
- Meaning of industrial policy and why a mixed economy needs one — "elaborate the statement" (1.5 marks).
- IPR 1948 — four categories (2 marks).
- IPR 1956 — three schedules, licensing (2 marks).
- 1970–1980 in brief (1 mark).
- NIP 1991 — reasons and features, privatisation (3 marks).
- Conclusion tying back to the quotation (0.5 mark).
Meaning. Industrial policy refers to the rules and regulatory laws formulated by the government to determine the ownership and pattern of growth of industries. Monetary and fiscal policy affect business but do not shape the industrial structure; that is the job of industrial policy. It decides which industries are public and which private, how private industry is regulated and promoted, and how small industry is protected — and so it determines the nature, scope and prospects of industrial growth.
1. Industrial Policy Resolution, 1948
- Declared India a mixed economy; gave importance to small-scale and cottage industries; restricted foreign investment.
- Divided industries into four categories: (i) exclusive monopoly of the central government — arms and ammunition, atomic energy, railways; (ii) basic and key industries where new undertakings would be set up only by the state — coal, iron and steel, aircraft manufacturing, ship-building, telegraph and telephone; (iii) industries of basic importance to be regulated by the government; (iv) the remainder open to private enterprise, individuals and co-operatives.
2. Industrial Policy Resolution, 1956
- Based on the goal of a socialist pattern of society; gave the government the leading role in industrialisation.
- Three-fold classification: Schedule A — 17 industries, exclusively the public sector; Schedule B — 12 industries, progressively state-owned with private participation; residual industries — the private sector.
- Industrial licensing: private industry could be set up and expanded only with a government licence; licensing was meant to locate industry in backward areas (regional equity); industrial concessions such as tax rebates were given.
3. Policies of 1970–1980. After the Dutt Committee found that licensing favoured large business houses, the 1970 policy restricted large houses and widened the public sector; 1973 created the joint sector; 1977 emphasised cottage and small industries in rural areas; 1980 relaxed controls and stressed infrastructure — the first step towards liberalisation.
4. New Industrial Policy, 1991 — announced on 24 July 1991 after the foreign-exchange crisis and IMF–World Bank conditions:
- De-reservation: 9 of the 17 industries reserved for the public sector were opened to private firms.
- Privatisation: a major reform reducing the role of the public sector. Privatisation means the transfer of ownership, management and control of public-sector enterprises to private entrepreneurs, done through disinvestment of government shares in PSUs. Its purpose is to bring financial discipline, efficiency and competitiveness, and to reduce the burden on the budget.
- Abolition of industrial licensing except for industries involving security, strategic concerns, safety, environment and hazards.
- Liberalised foreign investment: automatic approval of FDI up to 51% in 34 high-priority industries.
- Removal of MRTP investment controls on large houses, of phased manufacturing programmes and of the mandatory convertibility clause.
Conclusion. India's experience proves the statement. The state-led, licensed policies of 1948–1980 built a diversified industrial base but produced slow growth, concentration and red tape; the 1991 policy of liberalisation, privatisation and globalisation made Indian industry more efficient and internationally competitive. The policy chosen determined the nature, scope and prospects of industrial growth.
The synoptic covers three policies: IPR 1948 (mixed economy; small and cottage industries; restricted foreign investment; the four categories with their examples), IPR 1956 (government's role; three-fold classification; licensing for establishment and expansion; licensing for regional equity; industry concessions such as tax rebates) and the New Economic Policy 1991 (privatisation; reduction in the public sector; privatisation defined as transfer of ownership, management and control; purpose — financial discipline). The 1970–80 policies and the full list of 1991 features are what lift the answer above the key.
Revise → Short Notes 32 · Unit 5 · Industrial Policy of India
Papers, notes and syllabus used on this page
- QP_Final-Exam_Macroeconomics(703TG0C009)_Semester VII_2025-2026.pdf — the Final Examination question paper, 25 Nov 2025, 2 hours, 50 marks. Question wording on this page is quoted from it verbatim, including its typographical slips (for example "Monterey policy" in Q6).
- QP_Re-Exam_Macroeconomics(703TG0C009)_Semester VII_2025-2026.pdf — the Re-Examination question paper, 02 Feb 2026, same pattern and marks.
- ANS_Final-Exam_…pdf and ANS_Re-Exam_…pdf — the official SYNOPTICS, that is, the marking outlines. Every "What the official key expects" box on this page reports what these contain. They are used to identify marking points, not reproduced as model answers — see the warning at the top of the page.
- Course Policy_Macroeconmics_2026-27.pdf — supplies the exam pattern Policy p. 10 and the lecture-by-lecture instruction plan Policy pp. 6–8 used to map each question to its unit and lecture.
All four PDFs live in the repository’s questionpaper/ folder.
| Question | Unit & lecture | Unit page | Short note |
|---|---|---|---|
| Final Q1(a) — Micro vs Macro | Unit 1, Lec 1 | unit-01 | 01 |
| Final Q1(b) — MPC & APC | Unit 2, Lec 11 | unit-02 | 10 |
| Final Q1(c) — Disadvantages of inflation | Unit 3, Lec 17 | unit-03 | 22 |
| Final Q1(d) — Central bank & price stability | Unit 3, Lec 15–16 + Unit 4, Lec 19 | unit-03, unit-04 | 18, 25 |
| Final Q2 — Subject matter & features | Unit 1, Lec 3 | unit-01 | 02 |
| Final Q3 — Injections & leakages | Unit 2, Lec 5–6 | unit-02 | 07 |
| Final Q4 — Phases of the business cycle | Unit 3, Lec 13 | unit-03 | 15 |
| Final Q5 — Phillips curve & NAIRU | Unit 3, Lec 18 | unit-03 | 24 |
| Final Q6 — Liquidity trap | Unit 4, Lec 24 + Unit 2, Lec 9–10 | unit-04, unit-02 | 29, 13 |
| Final Q7 — CSR | Unit 5, Lec 29 | unit-05 | 33 |
| Re-Exam Q1(a) — Role of government | Unit 1, Lec 4 | unit-01 | 05 |
| Re-Exam Q1(b) — National income accounting | Unit 2, Lec 7 | unit-02 | 08 |
| Re-Exam Q1(c) — Two types of inflation | Unit 3, Lec 17 | unit-03 | 21 |
| Re-Exam Q1(d) — Money & money supply | Unit 4, Lec 21–22 | unit-04 | 28 |
| Re-Exam Q2 — Unemployment, inflation, growth | Unit 1, Lec 2 + Unit 3, Lec 15–16 | unit-01, unit-03 | 03, 19 |
| Re-Exam Q3 — IS–LM equilibrium & shifts | Unit 2, Lec 9–10 | unit-02 | 13 |
| Re-Exam Q4 — The two stabilisation policies | Unit 3, Lec 15–16 | unit-03, unit-03 | 19 |
| Re-Exam Q5 — Inflation & LDCs | Unit 3, Lec 17–18 | unit-03 | 21–23 |
| Re-Exam Q6 — Central bank & LoLR | Unit 4, Lec 19–20 | unit-04 | 27 |
| Re-Exam Q7 — Industrial policy | Unit 5, Lec 28 | unit-05 | 32 |
The textbook behind all of these is H. L. Ahuja, Macroeconomics: Theory and Policy (T1). Chapter and page mapping is on the Short Notes source table and in full on the References page.
Reading both papers together, the same areas come up every time:
- Q1 is always one Unit 1 part, one Unit 2 part, one inflation part and one money / central-bank part. Final: micro vs macro, MPC/APC, disadvantages of inflation, central bank and price stability. Re-Exam: role of government, national income accounting, types of inflation, money and money supply. Short Notes 01, 05, 08, 10, 21, 22, 25 and 28 cover all eight.
- Inflation is the single most-examined topic — four questions across the two papers (Final Q1c and Q5, Re-Exam Q1c and Q5), including a 10-mark Phillips-curve question that needs two diagrams.
- There is always one circular-flow or IS-LM question (Final Q3, Re-Exam Q3) and one stabilisation-policy question (Re-Exam Q4; Final Q6 on the liquidity trap is its monetary-policy twin).
- The last question is always Unit 5 — CSR (Final Q7) and industrial policy (Re-Exam Q7). Both are list-driven: the official keys mark them stakeholder by stakeholder and policy by policy.
- The central bank appears in both papers — price stability (Final Q1d) and sustainable development + lender of the last resort (Re-Exam Q6).
You answer Q1 plus any 4 of 6. In each paper three of the six optional questions came from Units 1–3 (midterm portion) and three from the post-midterm units — so revising only one half leaves you exactly one question of choice. Revise both halves.