Unit 05 — Layout and Capacity Planning
How physical space is arranged for manufacturing and services, how process layouts are actually designed, and how much capacity to plan for.
1. Facility Layout and Its Objectives Core syllabus concept
1Understand the Concept
Facility layout refers to the arrangement of activities, processes, departments, workstations, storage areas, aisles, and common areas within an existing or proposed facility p. 261. The basic objective of the layout decision is to ensure a smooth flow of work, material, people, and information through the system — everything else follows from that.
Beyond that basic objective, the textbook lists what an effective layout also achieves: minimise movement and material-handling costs; utilise space and labour efficiently; eliminate bottlenecks; facilitate communication and interaction between workers, supervisors and customers; reduce manufacturing cycle time and customer service time; eliminate wasted or redundant movement; facilitate the entry, exit and placement of material, products and people; incorporate safety and security measures; promote product and service quality; encourage proper maintenance activities; provide visual control of activities; provide flexibility to adapt to changing conditions; and increase capacity.
Two of those deserve emphasis because they connect to other units: eliminating bottlenecks ties directly to Unit 3, and increasing capacity shows that layout is not merely cosmetic — a better arrangement can raise output without buying new equipment.
2Simple Explanation
3Important Points
- Layout = arrangement of activities, processes, departments, workstations, storage, aisles and common areas.
- Basic objective: smooth flow of work, material, people, and information.
- Also: minimise material handling cost, use space/labour efficiently, eliminate bottlenecks, reduce cycle and service time, improve safety/quality/maintenance/visual control, provide flexibility, increase capacity.
- Layout decisions affect quality and competitiveness, not just cost.
4Exam-Ready Answer
Facility layout refers to the arrangement of activities, processes, departments, workstations, storage areas, aisles, and common areas within an existing or proposed facility. The basic objective of the layout decision is to ensure a smooth flow of work, material, people, and information through the system. Effective layouts also pursue several further objectives: they minimise movement and material-handling costs, utilise space and labour efficiently, eliminate bottlenecks, facilitate communication and interaction between workers, supervisors and customers, reduce manufacturing cycle time and customer service time, eliminate wasted or redundant movement, facilitate the entry, exit and placement of material, products and people, incorporate safety and security measures, promote product and service quality, encourage proper maintenance activities, provide visual control of activities, provide flexibility to adapt to changing conditions, and increase capacity. Because a layout determines how far and how often material and people must move, layout decisions directly affect not only operating cost but also quality and competitiveness, and a well-designed layout can increase the effective capacity of a facility without additional equipment.
Definition. Facility layout is the physical arrangement of machines, workstations, departments, storage and aisles within a facility. Layout design ensures the optimal arrangement of resources to facilitate smooth workflow, reduce movement and minimise delays.
Why layout design matters — the importance
- Minimises material handling — movement is pure cost and adds no value; layout is the main lever on it.
- Enhances productivity — shorter distances mean shorter flow times and higher throughput.
- Improves safety — well-planned aisles, clearances and separation of people from moving equipment.
- Raises employee morale — light, space, noise and convenient work positions affect how people work.
- Uses space efficiently — floor area is expensive and largely fixed.
- Reduces work-in-process and congestion.
- Provides flexibility for future changes in product or volume.
- Shapes customer experience in service settings — a store layout directly changes what is bought.
- Hard and costly to reverse, so a poor layout is paid for repeatedly, every day, for years.
Objectives of a good layout
- Smooth, unidirectional flow with no backtracking or cross-traffic.
- Minimum total material handling distance and cost.
- Effective utilisation of space, labour and equipment.
- Ease of supervision, coordination and maintenance.
- Flexibility to accommodate change.
- Safe and comfortable working conditions.
Example
- A hospital that places its radiology department at the opposite end of the building from the emergency department condemns every trauma patient to a long internal transfer. No amount of staff effort fixes it — the cost was locked in at the layout stage.
Closing line: layout is a decision made once and paid for every day — it determines the floor of what the process can achieve, no matter how well it is subsequently managed.
5Possible Exam Questions
- Define facility layout. State the objectives of a good facility layout.
- How can a layout decision increase the capacity of a facility?
- Explain the relationship between facility layout and bottleneck elimination.
- ENOperations Management — Plant Layout (English)MIDU STUDY
- HIPlant Layout in Operations Management — Facility Layout, Types, PrinciplesDWIVEDI GUIDANCE
- ENPlant Layout — Meaning, Principles, Importance, Objectives, TypesStudy For Dreams 23
2. Types of Layouts: Process, Product, and Fixed-Position Core syllabus concept
1Understand the Concept
A process layout, also known as a functional layout, groups similar activities together in departments or work centres according to the process or function they perform p. 262 — all drills in one work centre, all lathes in another; in a department store, women's clothing, men's clothing and cosmetics in separate departments. A process layout is characteristic of intermittent operations, service shops, job shops, or batch production, which serve different customers with different needs; the volume of each customer's order is low and the sequence of operations varies. Equipment is general-purpose and workers are skilled at operating it. Its advantage is flexibility; its disadvantage is inefficiency — jobs do not flow through the system in an orderly manner, backtracking is common, and queues develop.
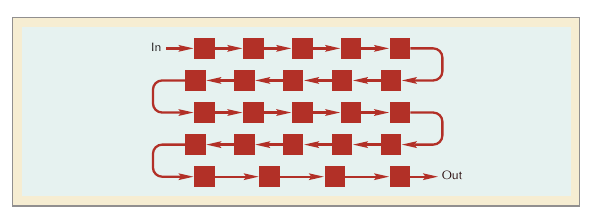
A product layout, better known as an assembly line, arranges activities in a line according to the sequence of operations needed to assemble a particular product p. 264. Work flows from one workstation to the next until the finished product comes off the end of the line. Product layouts suit mass production or repetitive operations where demand is stable and volume is high. The advantage is efficiency and ease of use; the disadvantage is inflexibility — a significant design change may require a new line and new equipment.
A fixed-position layout is typical of projects in which the product produced is too fragile, bulky, or heavy to move — ships, houses, and aircraft p. 266. The product remains stationary for the entire manufacturing cycle, and equipment, workers, materials, and other resources are brought to the production site. Equipment utilisation is low, because it is often less costly to leave equipment idle at a location where it will be needed again in a few days than to move it back and forth; equipment is frequently leased or subcontracted, and the workers called to the site are highly skilled at their specific tasks, so fixed cost tends to be relatively low while variable costs are high.
2Simple Explanation
3Example
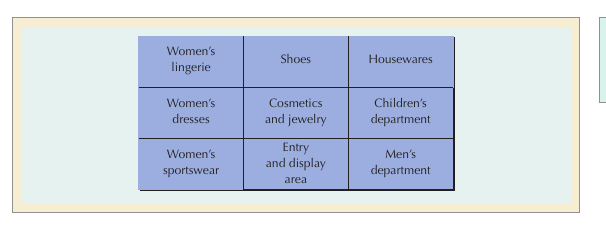
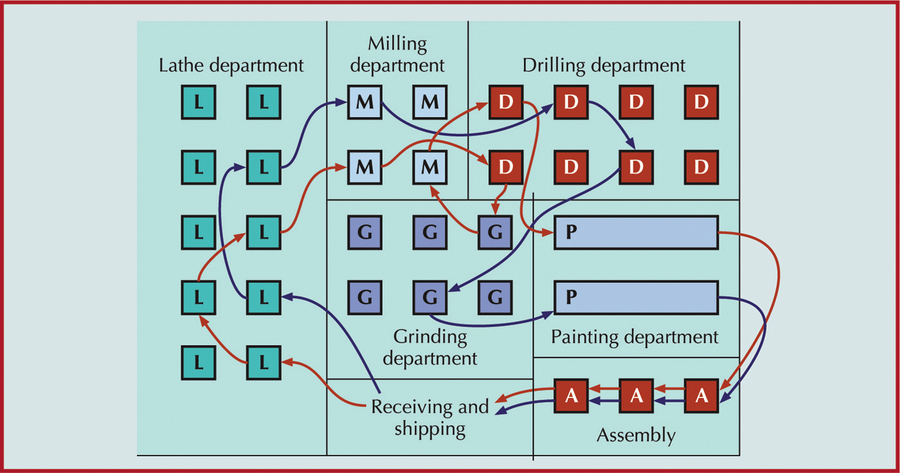
Your lecture applies the process layout to an automobile service station: separate areas with general-purpose equipment for dent correction, painting, wheel alignment, oil replacement, engine work, electrical check-up and interior cleaning. Different cars have different service requirements and are routed to different departments according to a schedule set by the service supervisor — the defining pattern of intermittent manufacturing Slides 6–7.
4Important Points — Comparison Table
| Product Layout | Process Layout | |
|---|---|---|
| Description | Sequential arrangement of activities | Functional grouping of activities |
| Type of process | Continuous, mass production, mainly assembly | Intermittent, job shop, batch, mainly fabrication |
| Product | Standardised, made to stock | Varied, made to order |
| Demand / Volume | Stable / High | Fluctuating / Low |
| Equipment | Special purpose | General purpose |
| Workers | Limited skills | Varied skills |
| Inventory | Low in-process, high finished goods | High in-process, low finished goods |
| Storage space | Small | Large |
| Material handling | Fixed path (conveyor) | Variable path (forklift) |
| Aisles | Narrow | Wide |
| Scheduling | Part of balancing | Dynamic |
| Layout decision | Line balancing | Machine location |
| Goal | Equalise work at each station | Minimise material handling cost |
| Advantage | Efficiency | Flexibility |
Table 7.1 — A Comparison of Product and Process Layouts p. 265
5Exam-Ready Answer
The three basic layout types are process, product, and fixed-position layouts. A process layout, also known as a functional layout, groups similar activities together in departments or work centres according to the process or function they perform, such as placing all drills in one work centre and all lathes in another. It is characteristic of intermittent operations, service shops, job shops, and batch production, which serve different customers with different needs, where the volume of each order is low and the sequence of operations varies considerably. Equipment is general purpose and workers are skilled at operating it; the advantage of this layout is flexibility and the disadvantage is inefficiency, since jobs do not flow through the system in an orderly manner, backtracking is common, and queues tend to develop. A product layout, better known as an assembly line, arranges activities in a line according to the sequence of operations required to assemble a particular product, so that work flows from one workstation to the next until the finished product comes off the end of the line. It suits mass production or repetitive operations where demand is stable and volume is high; its advantage is efficiency and ease of use, and its disadvantage is inflexibility. A fixed-position layout is typical of projects in which the product is too fragile, bulky, or heavy to move, such as ships, houses, and aircraft; the product remains stationary and equipment, workers, and materials are brought to the site. Equipment utilisation is low because it is often less costly to leave equipment idle on site than to move it repeatedly, and the workers used are highly skilled, so fixed costs are relatively low while variable costs are high.
Definition. The basic layout types are distinguished by what determines the arrangement: process layout groups by function, product layout arranges by sequence of operations, and fixed-position layout keeps the product stationary and brings resources to it.
The comparison table — the core of the answer
| Basis | Process layout | Product layout | Fixed-position layout |
|---|---|---|---|
| Arrangement | Machines grouped by function (all mixers together, all ovens together) | Machines arranged in the sequence of operations | Product stays put; labour, material and equipment come to it |
| Suits | High variety, low volume — job shop, batch | Low variety, high volume — mass production | Large, heavy or immovable products |
| Equipment | General-purpose | Special-purpose, dedicated | Mobile / brought in as needed |
| Labour | Skilled, flexible | Semi-skilled, specialised | Highly skilled, varied trades |
| Flow | Irregular, variable routing | Straight-line, standardised | Little product flow; resource flow instead |
| WIP inventory | High | Low | Variable, often high |
| Unit cost | High | Low | Very high |
| Flexibility | High | Low | High but expensive |
| Vulnerability | One breakdown reroutable | One breakdown halts the whole line | Coordination and space conflicts |
| Example | Hospital, machine shop, university | Automobile assembly, bottling plant | Shipbuilding, construction, aircraft assembly |
Advantages and disadvantages — stated compactly
- Process layout + flexible for many products; handles custom orders; better use of specialised equipment; breakdown reroutable. − more material handling and movement between stations; longer production time per unit; difficult to schedule; high WIP.
- Product layout + high efficiency for large-scale uniform production; reduces material handling and transit time; easier to standardise and supervise; low unit cost. − less flexible for multiple varieties; high downtime impact if one machine fails; unsuitable for small batches or custom orders; monotonous work.
- Fixed-position + handles products that cannot be moved; minimises product damage; allows high customisation. − very high cost; complex scheduling of trades and equipment; space congestion around the product.
Worked application — the bakery comparison the Re-Exam asked
- Process layout in the bakery: all mixers in one area, all ovens in another, packaging separate; different breads travel to whichever stations they need. Good when the bakery makes many varieties in small quantities; costly in movement and scheduling.
- Product layout in the bakery: dough moves mixing → shaping → proving → baking → packaging in a straight line. Good when one or two breads are made in large volume; inflexible if the range widens.
- Recommendation: a bakery producing many types of bread in modest quantities should use process layout — or a cellular compromise, with a dedicated line for its two highest-volume breads and a flexible area for the rest.
Closing line: layout type is not a preference but a consequence — volume and variety choose the layout, which is precisely what the product–process matrix formalises (Unit 6).
6Possible Exam Questions
- Explain process, product, and fixed-position layouts with examples.
- Differentiate between product and process layouts on any five parameters.
- Why is equipment utilisation low in a fixed-position layout?
- A furniture company makes both mass-market standard tables and highly customised one-off pieces. What layout(s) would you recommend, and why?
7Common Mistakes
- Describing fixed-position layout as a variant of process layout — it is a distinct third type, defined by the product being immobile.
- Saying process layouts are "bad" — they are deliberately chosen when flexibility matters more than efficiency.
- HIPlant Layout in Operations Management — Types of Plant LayoutDWIVEDI GUIDANCE
- ENOperations Management — Plant Layout (English)MIDU STUDY
- ENPlant / Facility Layout in Operations Management and Types of Plant LayoutShafique Ahmad
3. Designing Process Layouts: Block Diagramming Core syllabus concept
1Concept — What Is It Solving?
Knowing you need a process layout is not the same as knowing where to put each department. In designing a process layout the objective is to minimise movement or material-handling cost, which is a function of the amount of material moved times the distance it is moved p. 266. This implies that departments incurring the most interdepartmental movement should be located closest to each other, and those that do not interact should be located further apart. Two techniques do this: block diagramming (when quantitative data is available) and relationship diagramming (when it is not).
2Key Terms
- Load summary chart (from/to chart) — gives the average number of unit loads transported between departments over a period.
- Unit load — the quantity in which material is normally moved: a single unit, a pallet, a bin, or a crate. In automobile manufacturing a single car is a unit load; for a ball-bearing producer it might be a bin of 100 or 1000 bearings.
- Composite movement — the back-and-forth movement between each pair of departments, represented by a two-headed arrow.
- Nonadjacent load — a load that must travel a distance farther than the next block, whether horizontally, vertically, or diagonally.
3Step-by-Step Method
- Start from data on historical or predicted movement of material between departments — the load summary chart.
- Calculate the composite movements between departments and rank them from most movement to least.
- Place trial layouts on a grid that graphically represents relative distances between departments as uniform blocks.
- Assign each department to a block so that nonadjacent loads are minimised; score each trial layout by its number of nonadjacent loads.
- Repeat with different configurations until an acceptable layout is found. Ideally the optimal layout would have zero nonadjacent loads, but in practice this is rarely possible.
4Textbook Example — Example 7.1 (Barko, Inc.)
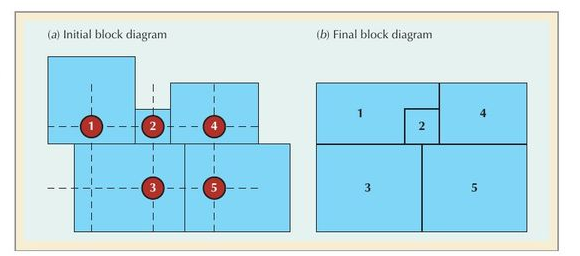
Barko, Inc. makes bark scalpers — equipment that strips bark off trees and turns it into mulch. The facility is a small job shop employing 50 workers, arranged into five departments: (1) bar stock cutting, (2) sheet metal, (3) machining, (4) painting, and (5) assembly. Given the average number of loads transported between departments per month and a current 2 × 3 grid layout (six possible locations for five departments), the task is to propose a layout that minimises the number of nonadjacent loads. This is exactly the problem your lecture poses Slide 30; the full worked solution is on textbook pp. 267–270.
5Exam-Ready Answer
In designing a process layout the objective is to minimise movement or material-handling cost, which is a function of the amount of material moved multiplied by the distance it is moved. This implies that departments which incur the most interdepartmental movement should be located closest to each other, while those that do not interact should be located further away. Block diagramming achieves this using quantitative data. It begins with a load summary chart, or from/to chart, giving the average number of unit loads transported between departments over a given period, where a unit load is the quantity in which material is normally moved — a single unit, a pallet, a bin, or a crate. The next step is to calculate the composite movements between each pair of departments, representing the back-and-forth movement between them, and to rank these from most to least movement. Trial layouts are then placed on a grid that graphically represents the relative distances between departments in the form of uniform blocks, and each department is assigned to a block so that nonadjacent loads are minimised, where nonadjacent means a distance farther than the next block horizontally, vertically, or diagonally. Trial layouts are scored on the number of nonadjacent loads, and different configurations are tried until an acceptable layout is found. Ideally the optimal layout would have zero nonadjacent loads, though in practice this is rarely achievable.
Definition. Block diagramming is the technique for designing a process layout: it arranges departments in a grid so as to minimise non-adjacent loads — that is, to place the departments with the heaviest traffic between them next to each other.
Key terms to define first
- Unit load — the quantity in which material is normally moved between departments (a pallet, a trolley, a trip).
- Load summary chart — a matrix showing the number of loads moving between every pair of departments.
- Non-adjacent load — a load that must travel between departments that are not next to each other; this is what the design tries to eliminate.
The steps
- Build the load summary chart from routing and volume data.
- Create an initial schematic, placing the department pairs with the highest loads adjacent to one another.
- Convert the schematic into a block diagram on a grid, respecting real space requirements.
- Count the non-adjacent loads; swap departments and recount.
- Iterate until non-adjacent loads cannot be reduced further, then check the result against physical constraints — walls, utilities, doors, weight limits.
Why it works, and its limits
- Material handling cost is roughly proportional to load × distance; adjacency drives distance to a minimum, so heavy-traffic pairs matter most.
- It is a heuristic, not an optimisation — it produces a good arrangement, not a provably best one.
- It ignores factors adjacency cannot express: noise, contamination, safety separation, security. Those come from Muther's grid.
Example
- In a machine shop where 200 loads/week move between cutting and welding but only 10 between cutting and packing, block diagramming places cutting beside welding and lets packing sit further away — the arrangement that looks "logical" by process order may be exactly wrong.
Closing line: block diagramming turns layout from an aesthetic judgement into a traffic problem — the departments that talk most should sit closest.
6Common Mistakes
- Counting one-way movement instead of the composite (two-way) movement between a pair of departments.
- Treating diagonal neighbours as nonadjacent — the textbook counts horizontal, vertical and diagonal next-blocks as adjacent.
- ENTools and Techniques used for Plant Layout PlanningOperations Management — IIT Roorkee
- ENOperations Management — Plant Layout (English)MIDU STUDY
4. Relationship Diagramming & Muther's Grid Core syllabus concept
1Concept — What Is It Solving?
Block diagramming needs numbers. But in many situations quantitative data is difficult to obtain, or does not adequately address the layout problem — how do you put a number on "the locker room shouldn't be next to the offices"? In those cases the load summary chart is replaced with subjective input from analysts or managers p. 269.
Richard Muther developed a format for displaying manager preferences for departmental locations, known as Muther's grid. Preference information is coded into six categories associated with the five vowels A, E, I, O, U plus the letter X, where the vowels match the first letter of the closeness rating:
| Code | Closeness rating |
|---|---|
| A | Absolutely necessary |
| E | Especially important |
| I | Important |
| O | Okay |
| U | Unimportant |
| X | Undesirable |
The diamond-shaped grid is read like the mileage chart on a road map. The information in it is then used to construct a relationship diagram — a schematic diagram that uses weighted lines to denote location preference. Thicker lines (three, four or five strands) identify the highest-priority closeness ratings (important, especially important, absolutely necessary); thin lines represent unimportant or okay ratings and can be any length; and an undesirable rating is marked with a zigzagged line. Visually, the best solution shows short heavy lines and no zigzagged lines.
2Simple Explanation
3Example
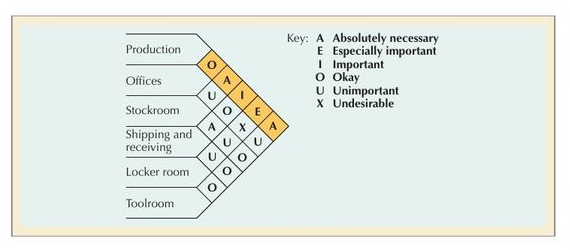
Reading down the highlighted row of that grid: it is okay if the offices are next to production, absolutely necessary that the stockroom be next to production, important that shipping and receiving be next to production, especially important that the locker room be next to production, and absolutely necessary that the toolroom be next to production.
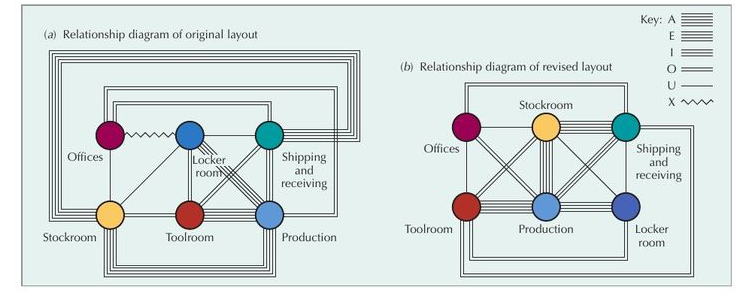
From diagram (a) it is obvious that production and shipping/receiving are located too far from the stockroom, and that the offices and locker room are located too close to one another. The revised layout in (b) satisfies the preferences expressed in Muther's grid: the heavy lines are short and within the perimeter of the grid, the lengthy lines are thin, and there are no zigzagged lines.
4Important Points
- Use relationship diagramming when quantitative movement data is unavailable or inadequate.
- Muther's grid codes manager preferences as A (absolutely necessary), E (especially important), I (important), O (okay), U (unimportant), X (undesirable).
- Relationship diagram = weighted lines; thicker = higher closeness priority; zigzag = undesirable adjacency.
- A good solution = short heavy lines, no zigzagged lines.
- Computerised alternatives exist: CRAFT (uses load summary chart + block diagram, makes pairwise exchanges) and CORELAP (uses relationship diagramming, places A-rated pairs first).
5Exam-Ready Answer
Block diagramming is appropriate for designing process layouts when quantitative data on interdepartmental movement is available. However, in situations where such data is difficult to obtain or does not adequately address the layout problem, the load summary chart can be replaced with subjective input from analysts or managers. Richard Muther developed a format for displaying manager preferences for departmental locations, known as Muther's grid, in which preference information is coded into six categories associated with the five vowels A, E, I, O and U, plus the letter X: A means absolutely necessary, E especially important, I important, O okay, U unimportant, and X undesirable, with the vowels matching the first letter of each closeness rating. The diamond-shaped grid is read in the same way as a mileage chart on a road map. The information from Muther's grid is then used to construct a relationship diagram, a schematic diagram that uses weighted lines to denote location preference: thicker lines identify the closeness ratings with the highest priority, thin lines represent unimportant or okay ratings and may be of any length, and undesirable closeness ratings are marked with a zigzagged line. Visually, the best solution shows short heavy lines and no zigzagged lines, indicating that departments which must be close together are adjacent and those that must be apart are separated.
Definition. Relationship diagramming, using Muther's grid, is a layout technique that arranges departments according to qualitative closeness requirements rather than measured material flow — used when the reasons for proximity are not volume-based.
The six closeness ratings — memorise these
| Code | Meaning |
|---|---|
| A | Absolutely necessary |
| E | Especially important |
| I | Important |
| O | Ordinary closeness OK |
| U | Unimportant |
| X | Undesirable — must be kept apart |
Mnemonic: A-E-I-O-U in decreasing order of importance, plus X for "keep apart".
The steps
- List all departments.
- For each pair, assign a closeness rating and record the reason code for it.
- Build the triangular relationship (Muther's) grid.
- Position A-rated pairs adjacent first, then E, then I; ensure X-rated pairs are separated.
- Convert to a block diagram and check against space and physical constraints.
When to use it instead of block diagramming
- In services, where there is little physical material flow to measure at all.
- When proximity is driven by non-flow reasons: shared staff or equipment, supervision, noise, contamination, safety, security, customer convenience.
- When some pairs must be actively separated — an X rating has no equivalent in a load chart.
- In practice the two are combined: block diagramming for the flow, Muther's grid for the constraints.
Example
- In a hospital, Emergency and Radiology are rated A; the kitchen and the mortuary are rated X. Neither relationship comes from load volume — one is clinical urgency, the other hygiene and dignity, and no material-flow analysis would ever have discovered either.
Closing line: Muther's grid exists because the most important adjacency requirements in a facility are often the ones that carry no material at all.
6Possible Exam Questions
- What is Muther's grid? Explain the six closeness ratings.
- Explain relationship diagramming. When would you use it instead of block diagramming?
- How do you visually recognise a good layout from a relationship diagram?
- Differentiate between block diagramming and relationship diagramming.
7Common Mistakes
- Forgetting that X is not a vowel rating — it means undesirable, drawn as a zigzag, and is the one rating you want to see absent between adjacent departments.
- Mixing up E and I: E = Especially important (higher), I = Important (lower).
- ENTools and Techniques used for Plant Layout PlanningOperations Management — IIT Roorkee
5. Hybrid Layouts: Cellular, FMS, and Mixed-Model Lines Core syllabus concept
1Understand the Concept
Process layouts are flexible but inefficient; product layouts are efficient but inflexible. Hybrid layouts attempt to capture both. A cellular layout groups dissimilar machines into work centres, called cells, that process families of parts with similar shapes or processing requirements p. 278 — instead of routing a part across the whole factory or dedicating an entire line to one product, a cell handles a whole family of similar parts efficiently in one place.
A flexible manufacturing system (FMS) consists of numerous programmable machine tools connected by an automated material-handling system and controlled by a common computer network, with automated tool changing — combining flexibility with efficiency. A mixed-model assembly line processes more than one product model on the same line, avoiding the cost of a separate dedicated line per variant.
2Simple Explanation
3Important Points
- Cellular layout groups machines by part family, not by function. Steps: identify part families with similar flow paths → group machines into cells → arrange cells to minimise material movement → locate large shared machines at point of use.
- Advantages: reduced material handling and transit time, reduced setup time, reduced work-in-process inventory, better use of human resources, easier to control, easier to automate.
- Disadvantages: inadequate part families, poorly balanced cells, expanded training and scheduling of workers, increased capital investment.
- FMS: programmable machine tools + automated material handling + common computer control; layouts differ by variety of parts, size of parts, and average processing time.
- Mixed-model assembly line: more than one product model processed on one line.
4Exam-Ready Answer
Hybrid layouts combine features of process and product layouts in order to obtain both flexibility and efficiency. A cellular layout groups dissimilar machines into work centres, called cells, that process families of parts with similar shapes or processing requirements. It is designed by identifying families of parts with similar flow paths, grouping machines into cells based on those part families, arranging the cells so that material movement is minimised, and locating large shared machines at their point of use. The advantages of cellular layouts are reduced material handling and transit time, reduced setup time, reduced work-in-process inventory, better use of human resources, and greater ease of control and automation; the disadvantages are the difficulty of identifying adequate part families, the risk of poorly balanced cells, the expanded training and scheduling required of workers, and increased capital investment. A flexible manufacturing system consists of numerous programmable machine tools connected by an automated material-handling system and controlled by a common computer network with automated tool changing, combining flexibility with efficiency; its layout depends on the variety of parts the system can process, the size of those parts, and the average processing time required. A mixed-model assembly line applies the efficiency of a product layout to several product variants by processing more than one product model on the same line, avoiding the cost of separate dedicated lines.
Definition. Hybrid layouts combine the flexibility of process layout with the efficiency of product layout. The three main forms are cellular layouts, flexible manufacturing systems (FMS) and mixed-model assembly lines.
Cellular layout
- Dissimilar machines are grouped into cells, each dedicated to producing a family of similar parts.
- Part families are identified by group technology — grouping parts with similar shapes, sizes or processing requirements.
- Within a cell the flow is product-like (a small U-shaped line); across cells the shop remains process-like and flexible.
- Benefits: less material handling and travel; shorter setup times because the cell handles similar parts; lower WIP; shorter flow time; cell teams own quality; easier scheduling.
- Limitations: duplicate equipment across cells; lower machine utilisation; needs cross-trained operators; re-forming cells is disruptive when the product mix changes.
- U-shape is standard because it lets one operator tend several machines and puts start and finish next to each other.
Flexible manufacturing system (FMS)
- A group of CNC machines linked by automated material handling, under central computer control.
- Can switch between products with almost no changeover time, giving variety at near-line efficiency.
- Limitations: very high capital cost, technical complexity, and the whole system is vulnerable to a single control failure.
Mixed-model assembly line
- A single line producing several models in sequence rather than long runs of one model.
- Requires: short setup times, balanced work content across models, and a carefully planned model sequence.
- Benefit: responds to a varied demand mix without holding finished inventory of each model — the layout expression of mass customisation.
Where hybrids sit
| Process | Cellular / FMS | Product | |
|---|---|---|---|
| Variety | High | Moderate | Low |
| Volume | Low | Moderate | High |
| Unit cost | High | Moderate | Low |
| Flexibility | High | Moderate–high | Low |
Example
- A pump manufacturer with 300 part numbers groups them into six families by size and material, and builds a cell for each. Setup time falls because every part in a cell needs a similar fixture, and flow time drops from weeks to days — without buying a dedicated line for each of 300 parts.
Closing line: hybrid layouts exist because the process/product choice is a false dichotomy — most real firms have moderate volume and moderate variety, which is exactly the gap cells were invented to fill.
5Possible Exam Questions
- What is a cellular layout? Explain its advantages and disadvantages.
- Differentiate between a flexible manufacturing system and a mixed-model assembly line.
- Why are hybrid layouts said to combine the strengths of process and product layouts?
- ENPlant Layout — Types including Cellular LayoutStudy For Dreams 23
- ENPlant / Facility Layout and Types of Plant LayoutShafique Ahmad
6. Designing Service Layouts Core syllabus concept
1Understand the Concept
Your syllabus names "layout for service functions" as a distinct topic. A service layout — a retail store above all — must be both attractive and functional p. 273: it is simultaneously a workspace and a piece of marketing. Four arrangements are used:
- Free-flow layouts encourage browsing, increase impulse purchasing, are flexible and visually appealing.
- Grid layouts encourage customer familiarity, are low cost, easy to clean and secure, and good for repeat customers.
- Loop and spine layouts both increase customer sightlines and exposure to products, while encouraging the customer to circulate through the entire store.
2Example
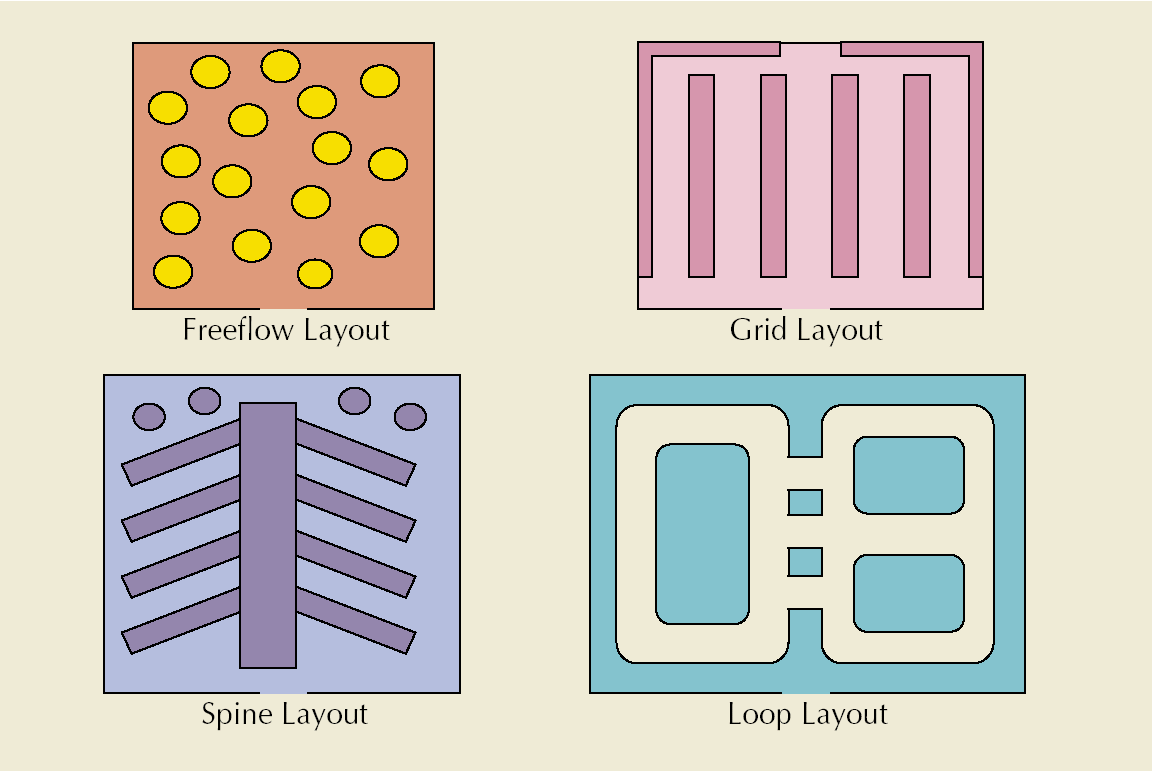
A supermarket uses a grid layout so regular shoppers navigate quickly and predictably to the same items each week, keeping the store easy to restock, clean and secure. A fashion boutique instead uses a free-flow layout with irregularly placed fixtures, encouraging customers to wander, browse and make unplanned purchases.
3Exam-Ready Answer
Service layouts, and retail layouts in particular, must be both attractive and functional, because the layout forms part of the customer's experience as well as the operation's workspace. Free-flow layouts arrange fixtures irregularly to encourage browsing and increase impulse purchasing; they are flexible and visually appealing, which suits boutique and fashion retail. Grid layouts use straight, parallel aisles that encourage customer familiarity, are low cost, and are easy to clean and secure, making them good for repeat customers and therefore well suited to supermarkets, where shoppers make frequent planned purchases. Loop and spine layouts both increase customer sightlines and exposure to products while encouraging the customer to circulate through the entire store — a loop guiding customers along a single major aisle, and a spine running a central corridor with departments branching from it. The appropriate choice depends on whether the business benefits more from browsing and impulse buying or from efficient, repeat, planned shopping.
Definition. Service layouts arrange space to influence customer behaviour and experience, not just material flow — because in a service the customer is inside the process. The four standard retail layouts are free-flow, grid, loop and spine.
The four service layouts
| Layout | Arrangement | Achieves | Best for |
|---|---|---|---|
| Free-flow | Fixtures placed informally, no fixed path | Encourages browsing, increases impulse purchasing, flexible and visually appealing | Boutiques, apparel, department stores |
| Grid | Long parallel aisles, rectangular fixtures | Encourages customer familiarity, low cost, easy to clean and secure, good for repeat customers | Supermarkets, pharmacies, hardware |
| Loop (racetrack) | A single main aisle circling the store past all departments | Increases customer sightlines and exposure to products; encourages circulation through the entire store | Large stores, IKEA-style retailers |
| Spine | A single main aisle running front to back, departments branching off it | Same exposure benefits as loop, while retaining flexibility on each side | Medium stores, category retailers |
Evaluating them against the two goals
- Operational efficiency — grid wins clearly: highest space utilisation, cheapest fixtures, simplest restocking, easiest surveillance.
- Customer satisfaction and revenue per visit — free-flow wins for exploratory shopping; loop wins for exposure, since customers pass everything.
- The trade-off: grid maximises efficiency but feels utilitarian and lets customers take the shortest path to what they came for; free-flow maximises browsing but wastes space and complicates restocking.
Justifying a choice by context — what the 5-mark question wants
- Supermarket → grid. Customers make frequent repeat trips with long lists; familiarity and speed matter more than discovery, and space efficiency is decisive at low margins.
- Fashion boutique → free-flow. Purchases are discretionary and emotional; browsing time correlates directly with spend.
- Large furniture retailer → loop. Guaranteeing exposure to every category justifies the forced path; the visit is an outing, not an errand.
- Bank or clinic → neither; use flow-based design. Here the objective is minimising customer waiting, so the layout follows the service-process sequence, with a clear queue and visible progress.
What makes service layout different from manufacturing layout
- The customer is physically present and their route is the process route.
- Servicescape — lighting, music, signage, cleanliness — is part of the product, not decoration.
- Layout directly drives revenue, not merely cost — an aisle arrangement changes what is bought.
Closing line: in manufacturing the layout moves the product past the worker; in services it moves the customer past the product — which is why service layout is a marketing decision as much as an operations one.
4Possible Exam Questions
- Explain the different types of service/retail layouts with examples.
- Why would a supermarket prefer a grid layout while a fashion boutique prefers a free-flow layout?
- ENOperations Management — Plant Layout (English)MIDU STUDY
- ENPlant Layout — Meaning, Principles, Importance, TypesStudy For Dreams 23
7. Designing Product Layouts: Line Balancing Core syllabus concept
1Concept — What Is It Solving?
The design problem for a product layout is line balancing: assigning tasks to workstations so the amount of work at each station is roughly equal and no station becomes a bottleneck holding up the whole line. Line balancing operates under two constraints p. 274: precedence requirements — physical restrictions on the order in which operations are performed — and cycle time, the maximum amount of time a product is allowed to spend at each workstation.
A useful clarification your lecture makes: cycle time here is the maximum time spent at any one station, whereas flow time is the time to complete all stations Slide 41. Cycle time can also be viewed as the time between completed items rolling off the line.
2Formula
ti = completion time for element i · n = actual number of workstations · Ca = actual cycle time (max workstation time on the line) · Cd = desired cycle time
3Step-by-Step Method
- Draw and label a precedence diagram.
- Calculate the desired cycle time required for the line.
- Calculate the theoretical minimum number of workstations.
- Group elements into workstations, recognising cycle time and precedence constraints.
- Calculate the efficiency of the line.
- Determine whether the theoretical minimum number of workstations or an acceptable efficiency level has been reached; if not, return to step 4.
4Worked Example
Real fruit snack strips are made by pressing a mixture into a sheet, imprinting shapes, rolling and packaging. Tasks: A press out sheet (0.1 min, no precedence), B cut into strips (0.2, after A), C outline fun shapes (0.4, after A), D roll up and package (0.3, after B and C). Demand: 6,000 strips per 40-hour week.
Cd = (40 × 60) / 6,000 = 0.4 min/unit · Σti = 1.0 min · N = 1.0 / 0.4 = 2.5 → round up to 3 workstations
Grouping A+B (0.3 min), C (0.4 min), D (0.3 min) respects precedence and keeps every station within the 0.4 min cycle time. Efficiency = 1.0 / (3 × 0.4) = 83.3%, so balance delay = 16.7% of available station time.
5Important Points
- Cycle time is set by the required output rate, not by any individual task time.
- The theoretical minimum number of stations is a lower bound — always round up; actual grouping may need more.
- Efficiency uses the actual number of stations and the actual cycle time; balance delay is the complement.
- Product-layout goal = equalise work at each station (vs. process-layout goal = minimise material handling cost).
6Exam-Ready Answer
Line balancing is the process of designing a product layout by assigning tasks to workstations so that the amount of work at each station is approximately equal and no single station becomes a bottleneck that holds up the flow of work through the line. It operates under two constraints: precedence requirements, which are physical restrictions on the order in which operations can be performed, and cycle time, which is the maximum amount of time a product is allowed to spend at each workstation. The desired cycle time is calculated by dividing the production time available by the desired units of output, and the theoretical minimum number of workstations is obtained by dividing the sum of all element times by the desired cycle time, rounded up. Elements are then grouped into workstations so that no station's total time exceeds the cycle time and all precedence constraints are respected, after which the efficiency of the line is calculated as the sum of the element times divided by the product of the actual number of workstations and the actual cycle time; the total idle time on the line is the balance delay. If the theoretical minimum number of stations or an acceptable efficiency level has not been reached, the elements are regrouped and the calculation repeated. For example, a line with 1.0 minute of total task time and a desired cycle time of 0.4 minutes requires a theoretical minimum of 2.5, hence 3 workstations, and if three stations are used the line efficiency is 1.0 divided by 1.2, or 83.3 percent.
Definition. Line balancing is the assignment of tasks to workstations on an assembly line so that each station's work content is as close as possible to the cycle time, minimising idle time and the number of stations required.
What each term means — the interpretation skill
- Cycle time is set by demand, not by the machines: it is how often a unit must come off the line to meet the required output.
- Minimum theoretical stations is a lower bound — you almost never achieve it, because tasks are indivisible and precedence constraints restrict which can be combined.
- Efficiency tells you what fraction of the total available station-time is actually productive.
- Balance delay is the idle percentage — the waste the exercise exists to reduce.
Why perfect balance is rarely achievable
- Precedence constraints — some tasks must precede others, restricting groupings.
- Task indivisibility — a 40-second task cannot be split across two stations.
- The longest single task sets a floor on cycle time — the line can never run faster than its slowest indivisible task.
- Variability in human work times means a perfectly balanced line on paper still blocks and starves in practice.
How to read a balancing result — what an application question tests
- Given an efficiency of, say, 85%, you should say: 15% of paid station-time is idle; the bottleneck station's task content is closest to the cycle time; and improvement means moving work off that station or splitting its longest task.
- If required cycle time is shorter than the longest task, the line cannot meet demand at all — that task must be split, duplicated in parallel, or automated.
- Lowering cycle time (to raise output) always increases the number of stations needed.
Example
- An electronics line needs 400 units per 8-hour shift, so cycle time is 72 seconds. If one soldering task takes 85 seconds, no arrangement of stations can meet demand — the constraint is that single task, and the only options are two soldering stations in parallel or a faster method.
Closing line: line balancing is the layout expression of bottleneck management — the station nearest the cycle time is the bottleneck, and it alone determines whether the line meets its target.
7Common Mistakes
- Rounding the theoretical minimum number of stations down instead of up.
- Assigning tasks to a station without checking precedence.
- Using the theoretical rather than the actual number of stations in the efficiency formula.
- Confusing cycle time (max time at one station) with flow time (time through all stations).
- ENOperations Layout — Assembly Line Balancing IThe Business Doctor
- ENLine Balancing | Production Line Balancing | Assembly Line BalancingDigital E-Learning
- ENOperations & Supply Chain Management: Assembly Line BalancingThe Business Doctor
8. Capacity Planning & Expansion Strategies Core syllabus concept
1Understand the Concept
Capacity is the maximum capability to produce, and capacity planning establishes the overall level of productive resources for a firm p. 258. Long-term capacity planning is a strategic decision extending over a horizon long enough to obtain those resources — usually a year or more for building or expanding facilities. Capacity decisions affect product lead times, customer responsiveness, operating costs, and the firm's ability to compete: inadequate capacity can lose customers and limit growth, while excess capacity can drain resources and prevent investment in more lucrative ventures.
Your lecture sets out the capacity planning process itself Slide 2: estimate the capacity of present facilities → forecast long-range future capacity needs → identify and analyse sources of capacity to meet those needs → select from among the alternative sources.
Three basic strategies exist for the timing of capacity expansion relative to steady demand growth:
- Capacity lead strategy — capacity is expanded in anticipation of demand growth. This aggressive strategy is used to lure customers from competitors who are capacity-constrained or to gain a foothold in a rapidly expanding market; it also allows the firm to respond to unexpected surges and provide superior service during peak demand.
- Average capacity strategy — capacity is expanded to coincide with average expected demand. A moderate strategy in which managers are certain they can sell at least some portion of the expanded output and will endure some periods of unmet demand; roughly half the time capacity leads demand and half the time it lags.
- Capacity lag strategy — capacity is increased after an increase in demand has been documented. This conservative strategy produces a higher return on investment but may lose customers; it is used in industries with standard products and cost-based or weak competition, assuming lost customers will return once capacity expands.
Capacity can also be added incrementally or in one large step — incremental expansion is less risky but more costly. An attractive alternative to expanding capacity at all is outsourcing, in which suppliers absorb the risk of demand uncertainty.
2Simple Explanation
3Example
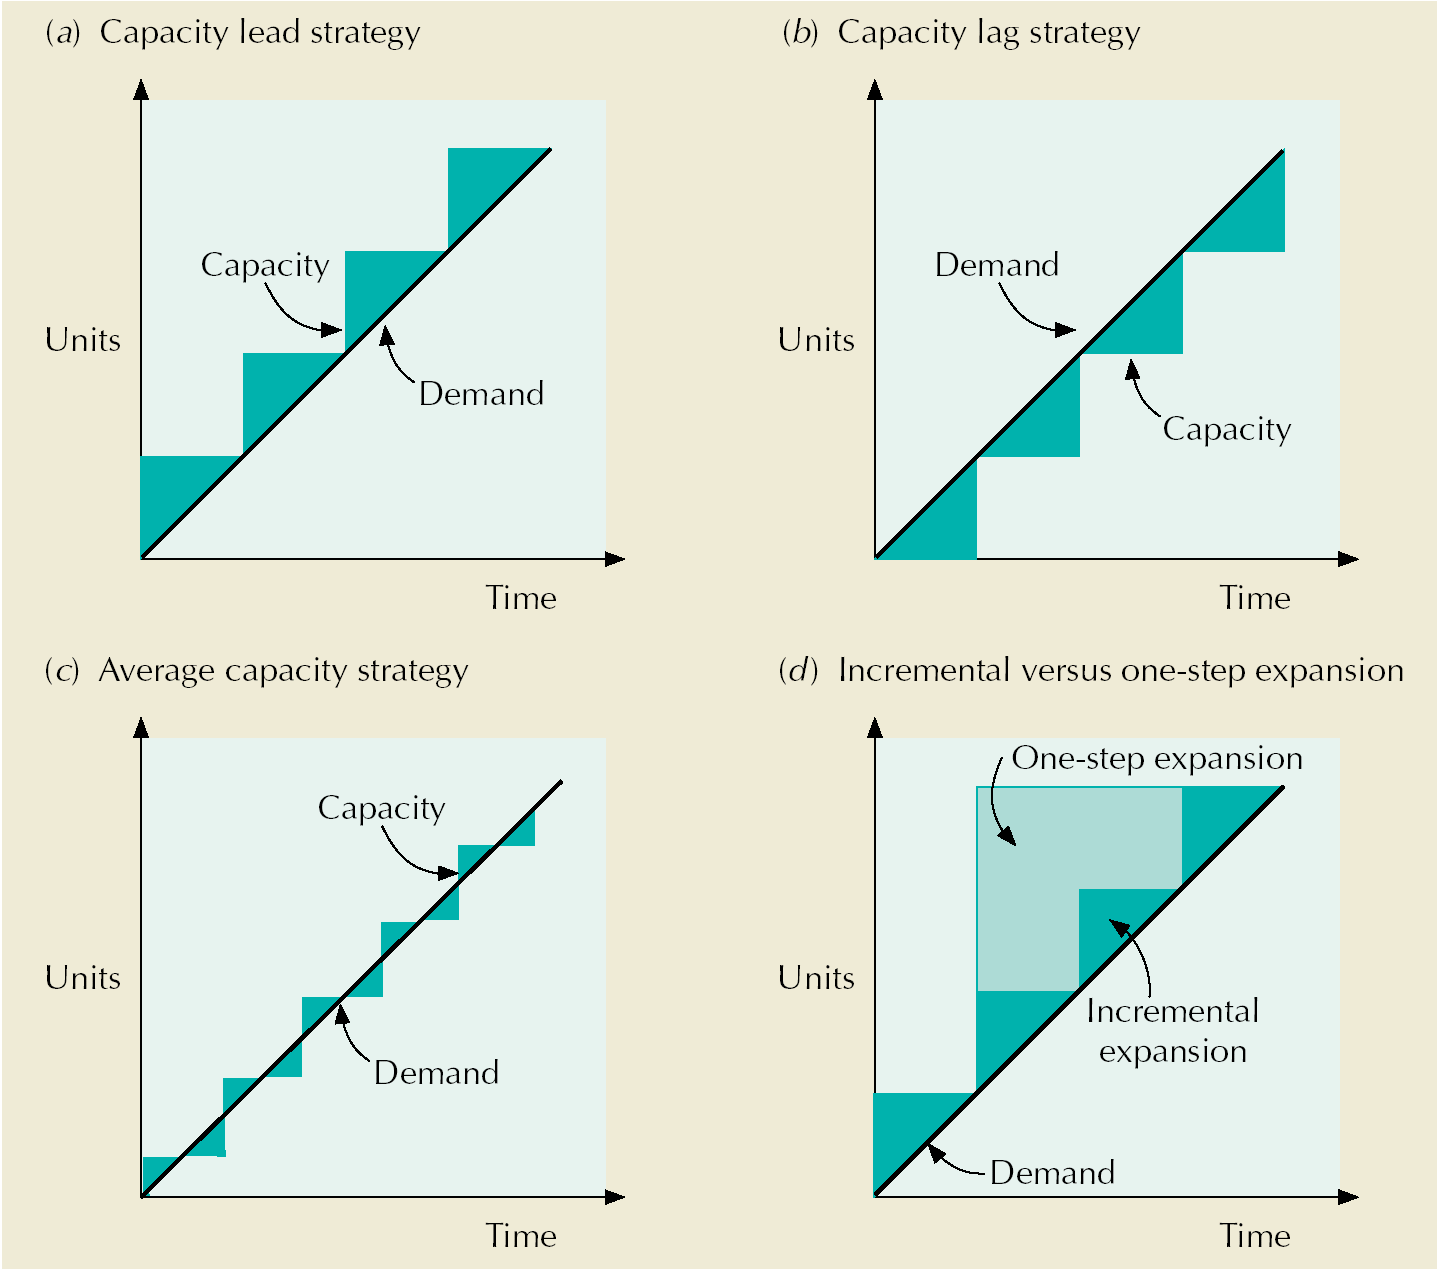
Consider higher education preparing for a tripling of the state's college-bound population. An established university, guaranteed applicants even in lean years, may follow a capacity lag strategy. A young university might lead capacity expansion, hoping to capture students not admitted to more established institutions. A community college may choose the average capacity strategy, fulfilling its mission with little risk.
4Important Points
- Capacity = maximum capability to produce; capacity planning establishes the firm's overall level of productive resources.
- Inadequate capacity loses customers and limits growth; excess capacity drains resources.
- Three timing strategies: lead (before demand), average (with demand), lag (after demand).
- How much to increase depends on: (1) volume and certainty of anticipated demand, (2) strategic objectives regarding growth, customer service and competition, (3) costs of expansion and operation.
- Incremental expansion is less risky but more costly than one-step expansion; outsourcing shifts demand risk to suppliers.
- Ways to expand long-term capacity: subcontract with other companies; acquire other companies, facilities or resources; develop sites and construct buildings/buy equipment; expand, update or modify existing facilities; reactivate standby facilities.
5Exam-Ready Answer
Capacity is the maximum capability to produce, and capacity planning establishes the overall level of productive resources for a firm. Long-term capacity planning is a strategic decision extending over a horizon long enough to obtain those resources, usually a year or more for building or expanding facilities. Capacity decisions affect product lead times, customer responsiveness, operating costs, and the firm's ability to compete, because inadequate capacity can lose customers and limit growth, while excess capacity can drain a company's resources and prevent investment in more lucrative ventures. Three basic strategies exist for the timing of capacity expansion relative to demand growth. Under a capacity lead strategy, capacity is expanded in anticipation of demand growth; this aggressive strategy is used to lure customers away from competitors who are capacity constrained or to gain a foothold in a rapidly expanding market, and it allows the firm to respond to unexpected surges in demand. Under an average capacity strategy, capacity is expanded to coincide with average expected demand, so that approximately half the time capacity leads demand and half the time it lags. Under a capacity lag strategy, capacity is increased only after an increase in demand has been documented; this conservative strategy produces a higher return on investment but may lose customers, and is used in industries with standard products and cost-based or weak competition. How much capacity to add depends on the volume and certainty of anticipated demand, the firm's strategic objectives, and the costs of expansion and operation. Capacity may be increased incrementally, which is less risky but more costly, or in one large step, and an attractive alternative to expansion is outsourcing, in which suppliers absorb the risk of demand uncertainty.
Definition. Capacity is the maximum output a process can produce in a given period. Capacity planning decides how much capacity to have, and expansion strategy decides when to add it relative to demand growth.
The three expansion strategies
| Strategy | Timing | Advantages | Risks | Suits |
|---|---|---|---|---|
| Lead (capacity cushion) | Add capacity ahead of demand | Never lose a sale; can take market share; deters entrants; room for surges | Idle capacity and cost if demand disappoints | Growing markets, high stockout cost, first-mover advantage |
| Lag | Add capacity after demand is proven | High utilisation; no wasted investment; lower risk | Lost sales and customers defect to rivals during shortages | Capital-intensive industries, uncertain demand, price-competitive markets |
| Match (tracking) | Add capacity in small increments alongside demand | Balances the two risks; moderate utilisation and service | Frequent small disruptions; forgoes scale economies of one big step | Steady, predictable growth |
Key concepts to name
- Design capacity — theoretical maximum under ideal conditions.
- Effective capacity — realistic maximum after allowing for maintenance, changeovers, breaks.
- Capacity cushion = 100% − utilisation; the deliberate slack held to absorb variability.
- A large cushion suits volatile demand, high stockout cost and high product variety; a small cushion suits capital-intensive, stable-demand operations.
Why capacity decisions are hard
- They are lumpy — you cannot buy a third of a machine or half a plant, so capacity moves in steps while demand moves smoothly.
- They have long lead times — the decision is taken years before the demand it serves.
- They are hard to reverse and tie up large capital.
- Short-term alternatives exist and should be named: overtime, extra shifts, subcontracting, hiring temporary staff, outsourcing, backlogging.
Example
- A cement manufacturer entering a fast-growing region builds ahead of demand (lead) because a new kiln takes three years and a competitor who arrives first will take the market. A speciality chemicals firm serving an uncertain niche adds a second reactor only once the first runs at 90% (lag), because an idle reactor would sink its returns.
Closing line: the capacity strategy question is really about which error is cheaper for this firm — lost sales, or idle assets — and that answer differs by industry, not by best practice.
6Possible Exam Questions
- Explain the lead, lag, and average capacity strategies with examples.
- Describe the steps in the capacity planning process.
- What factors determine how much capacity a firm should add?
- Compare incremental and one-step capacity expansion.
- A startup expects rapid but uncertain demand growth. Which capacity strategy would you recommend, and why?
7Common Mistakes
- Presenting the lead strategy as always superior — the answer must weigh idle-capacity cost against lost-sales risk for the given scenario.
- Omitting outsourcing as an alternative to expanding capacity, which the textbook explicitly names.
- ENCapacity Planning Strategies — A Comparison of Lead, Lag, Match and AdjustmentDr. Haywood
- ENWhat is Capacity Planning in Operations ManagementDr. Haywood
- ENLead vs Lag Capacity StrategyThe Guru of Biz
- ENCapacity Planning | Steps | Strategies | In EnglishERP Information
9. Best Operating Level, Economies & Diseconomies of Scale Core syllabus concept
1Understand the Concept
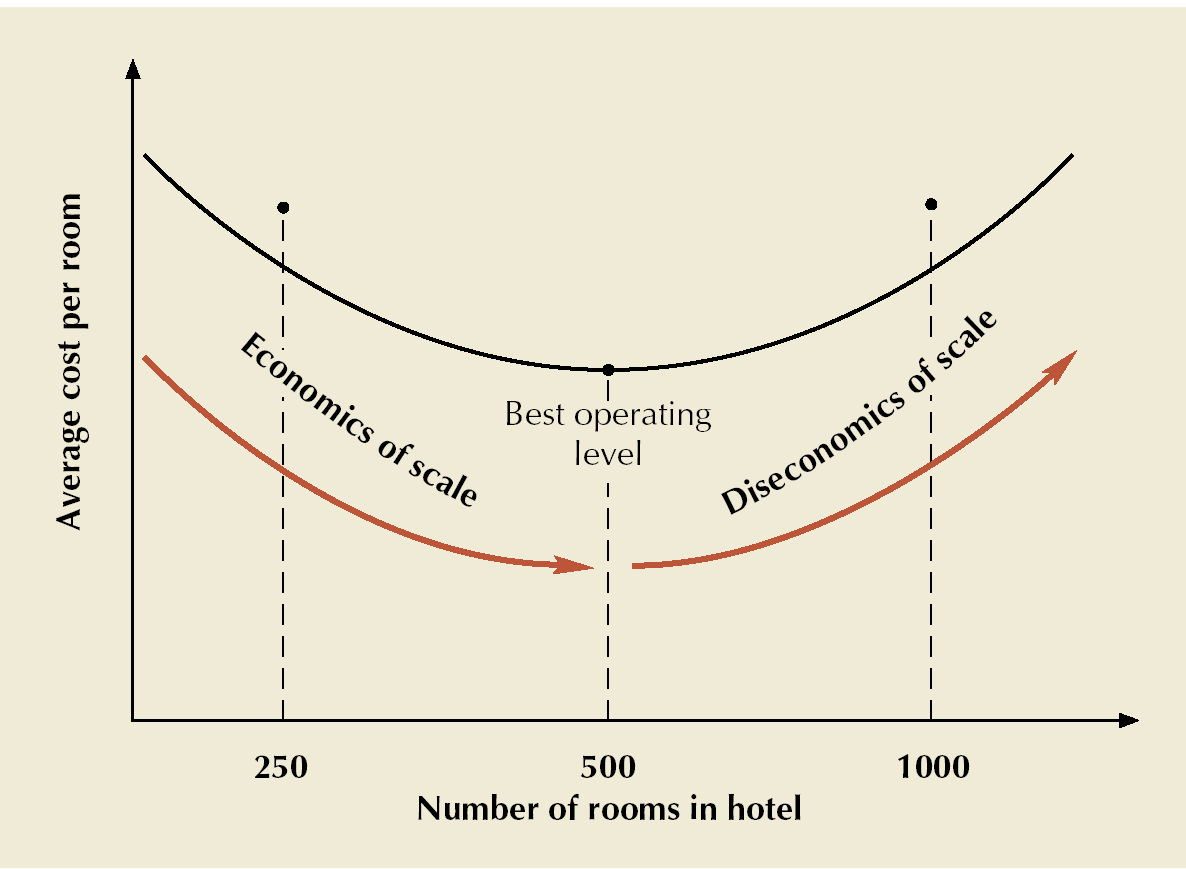
The best operating level for a facility is the percent of capacity utilisation that minimises average unit cost p. 259. Crucially, the textbook notes that rarely is the best operating level at 100% of capacity — at higher levels of utilisation, productivity slows and things start to go wrong. An industry with 80% average utilisation therefore has a 20% capacity cushion for unexpected surges in demand.
Below that level, economies of scale apply: average cost per unit decreases as volume increases toward the best operating level, because fixed costs are spread over more units, longer production runs allocate a smaller proportion of labour to setups, there is proportionally less material scrap, quantity discounts become available on material purchases, and operating efficiency rises as workers gain experience. Beyond that level, diseconomies of scale set in: average cost per unit increases as volume rises past the best operating level, because increased congestion of workers and material contributes to inefficiency, difficulty in scheduling, damaged goods, reduced morale, and increased use of overtime.
2Simple Explanation
3Example
4Important Points
- Best operating level = the % of capacity utilisation that minimises average unit cost — rarely 100%.
- Capacity cushion = % of capacity held in reserve for unexpected occurrences (100% − average utilisation).
- Economies of scale: fixed costs spread over more units; smaller proportion of labour on setups; proportionally less scrap; quantity discounts on materials; experience effects.
- Diseconomies of scale: congestion of workers and material → inefficiency, scheduling difficulty, damaged goods, reduced morale, more overtime.
5Exam-Ready Answer
The best operating level for a facility is the percent of capacity utilisation that minimises average unit cost. It is rarely at 100 percent of capacity, because at higher levels of utilisation productivity slows and problems begin to arise; the difference between full capacity and the average utilisation actually maintained is the capacity cushion, held in reserve for unexpected occurrences. Economies of scale describe the decline in average unit cost as output volume increases toward the best operating level. This occurs because fixed costs are spread over a larger number of units, longer production runs result in a smaller proportion of labour being allocated to setups, there is proportionally less material scrap, quantity discounts become available for material purchases, and operating efficiency increases as workers gain experience. Beyond the best operating level, diseconomies of scale set in and average unit cost begins to rise again, because the increased congestion of workers and material contributes to increasing inefficiency, difficulty in scheduling, damaged goods, reduced morale, and increased use of overtime. The relationship between volume and average unit cost is therefore U-shaped, and capacity planning aims to operate near the best operating level rather than simply maximising volume.
Definition. Economies of scale occur when average unit cost falls as output volume rises; diseconomies of scale occur when average unit cost begins to rise again beyond a certain size. The volume at which average unit cost is lowest is the best operating level.
Why unit cost falls — sources of economies of scale
- Fixed costs spread over more units — the single biggest effect.
- Purchasing power — bulk discounts on materials.
- Specialisation — division of labour and dedicated equipment become worthwhile.
- Process efficiency — high volume justifies automation.
- Learning curve — unit cost falls as cumulative experience accumulates.
Why unit cost rises again — sources of diseconomies
- Coordination and communication costs grow faster than size.
- Bureaucracy — more layers, slower decisions.
- Congestion and complexity on the shop floor.
- Motivation falls as individuals feel less connected to the outcome.
- Longer supply lines and higher distribution cost as the catchment widens.
- Loss of flexibility — a very large plant cannot respond to change.
Best operating level
- The output volume at which average unit cost is minimised — the bottom of the U-shaped average cost curve.
- Operating far below it wastes fixed cost; operating far above it incurs overtime, expediting and quality problems.
- Capacity utilisation rate = actual output ÷ best operating level, expressed as a percentage.
The strategic implication
- This is why firms often prefer several focused plants to one enormous one — each stays near its best operating level and avoids diseconomies.
- It links directly to capacity strategy: the "right" plant size is the one whose best operating level matches expected demand.
Example
- A cement plant doubling capacity roughly halves fixed cost per tonne — a textbook economy of scale. But a single plant serving three states starts paying so much in freight to distant markets that total delivered cost per tonne rises, which is why cement firms build regional plants rather than one national one.
Closing line: bigger is cheaper only up to a point — the operations question is not how large a facility can be, but where its cost curve turns.
6Possible Exam Questions
- Explain economies and diseconomies of scale with an example.
- What is the best operating level? Why is it rarely at 100% of capacity?
- Define capacity cushion and explain its purpose.
7Common Mistakes
- Assuming higher volume always means lower unit cost, or that the best operating level is 100% capacity — the textbook explicitly says it rarely is.
- ENWhat is Capacity Planning in Operations ManagementDr. Haywood
- ENOperations Management — Managing CapacityGlenn Parry