Unit 06 — Product-Process Matrix
Classifying production systems by volume and standardisation, and matching the right process to the right product.
1. Process Planning & the Outsourcing Decision Core syllabus concept
1Understand the Concept
Process planning determines how a product will be produced or a service provided. It decides which components will be made in-house and which will be purchased from a supplier, selects processes, and develops and documents the specifications for manufacture and delivery p. 228. It therefore involves two things: (1) sourcing decisions and (2) process selection Slide 9.
The sourcing half is the make-or-buy decision. A firm that sells the product, assembles it, makes all the parts and extracts the raw material is completely vertically integrated — but most companies cannot or will not make every part. The textbook lists six factors on which the outsourcing decision rests pp. 228–229:
- Cost — would it be cheaper to make or buy? The cost of buying includes purchase price, transportation, tariffs, taxes and fees, plus the cost of coordinating production over long distances and increased inventory. The cost of making includes labour, material and overhead.
- Capacity — companies operating below full capacity may make components rather than buy them, especially if maintaining a level workforce matters. Typically it is better to produce more customised or volatile products in-house and outsource steady, high-volume, highly standardised products.
- Quality — it is generally easier to control the quality of items produced in your own factory, though standardisation of parts, supplier certification and supplier involvement in design can improve supplied-part quality.
- Speed — savings from a far-off vendor can be eaten up by lengthy transit times; conversely a smaller supplier is often more flexible and can adapt quickly. Speed is useful only if it is reliable.
- Reliability — suppliers must be reliable in both the quality and the timing of supply; unexpected delays or quality rejects can wreak havoc on the manufacturing system.
- Expertise — companies especially good at making or designing certain items may want to keep control over their production. Coca-Cola would not release its formula to a supplier even with guarantees of secrecy, and automakers keep proprietary control over engines, transmissions and electronic guidance systems.
The outsourcing decision is not binary. Choices can be made along a sourcing continuum running from a single purchasing decision to a joint venture, ordered by the degree of company/supplier involvement.
2Simple Explanation
3Example
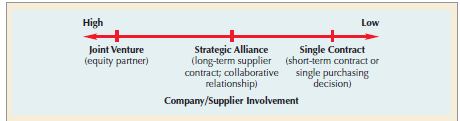
Your lecture explains how to read it Slide 11: a single contract (short-term contract or single purchasing decision) is used when the outsourcing decision is temporary; a strategic alliance signifies a supplier who is an important long-term partner, helping the company solve problems or improve processes; and a joint venture (equity partner) is used when entering or operating in a foreign country.
4Important Points
- Process planning = sourcing decisions + process selection; it converts designs into workable instructions for manufacture or delivery.
- Vertical integration = the degree to which a firm produces the parts that go into its products.
- Six outsourcing factors: cost, capacity, quality, speed, reliability, expertise.
- Rule of thumb: make customised/volatile products in-house; outsource steady, high-volume, high-standardisation products.
- Sourcing continuum: single contract → strategic alliance → joint venture, in increasing company/supplier involvement.
5Exam-Ready Answer
Process planning determines how a product will be produced or a service provided. It decides which components will be made in-house and which will be purchased from a supplier, selects the processes to be used, and develops and documents the specifications for manufacture and delivery; it therefore comprises sourcing decisions and process selection. A firm that sells the product, assembles it, makes all the parts, and extracts the raw material is completely vertically integrated, but most companies cannot or will not make all the parts that go into a product, so a major strategic decision is how much of the work should be done outside the firm. The outsourcing decision rests on six factors. Cost asks whether it would be cheaper to make or buy the item, where the cost of buying includes purchase price, transportation, tariffs and taxes as well as the cost of coordinating production over long distances, and the cost of making includes labour, material and overhead. Capacity matters because companies operating below full capacity may elect to make components rather than buy them, and it is typically better to produce customised or volatile products in-house while outsourcing steady products with high volume and high standardisation. Quality matters because it is generally easier to control the quality of items produced in one's own factory. Speed and reliability concern whether the supplier can deliver quickly and consistently, since unexpected delays or quality rejects can disrupt the manufacturing system. Expertise concerns proprietary knowledge, as companies especially good at making or designing certain items may wish to retain control rather than share that expertise with a supplier. The decision is not binary: choices lie along a sourcing continuum from a single short-term contract, through a strategic alliance with an important long-term supplier, to a joint venture with an equity partner, in increasing order of company and supplier involvement.
Definition. Process planning decides how a product will be made — which operations, in what sequence, on what equipment. Its first question is the make-or-buy decision: which activities the firm performs itself and which it outsources.
Vertical integration
- Vertical integration is the degree to which a firm owns the stages of its own supply chain.
- Backward integration — owning upstream stages (a carmaker owning a steel mill).
- Forward integration — owning downstream stages (a manufacturer owning its retail outlets).
- Outsourcing is the opposite direction: reducing integration by buying rather than making.
Make or buy — the decision criteria
| Make in-house when… | Outsource when… |
|---|---|
| It is a core competency — the thing you compete on | It is peripheral to what customers buy you for |
| Quality or IP must be tightly controlled | Suppliers have greater scale or specialised expertise |
| Volume is high enough to justify the fixed cost | Volume is low or highly variable |
| Suppliers are unreliable or few | A competitive, capable supplier market exists |
| Supply must be secure and confidential | Capital is better deployed elsewhere |
| Total cost of ownership favours making | The supplier's cost is genuinely lower after all coordination cost |
Risks of outsourcing — the balanced view
- Loss of control over quality and schedule.
- Hollowing out — losing the capability permanently, so you can never bring it back.
- Dependency on a supplier who may raise prices or become a competitor.
- Longer supply chains mean greater exposure to disruption.
- Intellectual property leakage.
- Coordination and contract-management cost that offsets the saving.
Example
- Apple outsources manufacturing to Foxconn but keeps design, silicon and software in-house — the outsourced activity is the one where scale matters and the retained ones are where the competitive advantage lives. Boeing's 787 programme is the counter-example: outsourcing so much design and integration created delays measured in years.
Closing line: the make-or-buy question is never purely a cost comparison — it is a decision about which capabilities the firm intends to still own in ten years.
6Possible Exam Questions
- What is process planning? What two decisions does it involve?
- Explain the factors influencing the make-or-buy (outsourcing) decision.
- What is vertical integration?
- Explain the sourcing continuum with examples of when each option is used.
- A company is deciding whether to manufacture a highly customised component in-house or outsource it. What would you advise, and why?
7Common Mistakes
- Treating outsourcing as a purely cost decision — the textbook explicitly lists the other five factors as ones that "can influence or dominate the economic considerations."
- Getting the rule backwards: customised/volatile work stays in-house; standardised high-volume work is the outsourcing candidate.
- ENWhat is Operations Strategy? Business Strategy & Competitive Advantage ExplainedLaurence Gartside
- ENProduction and Operations Management IPROF. ABRAHAM ANSONG
2. Types of Production Systems Core syllabus concept
1Understand the Concept
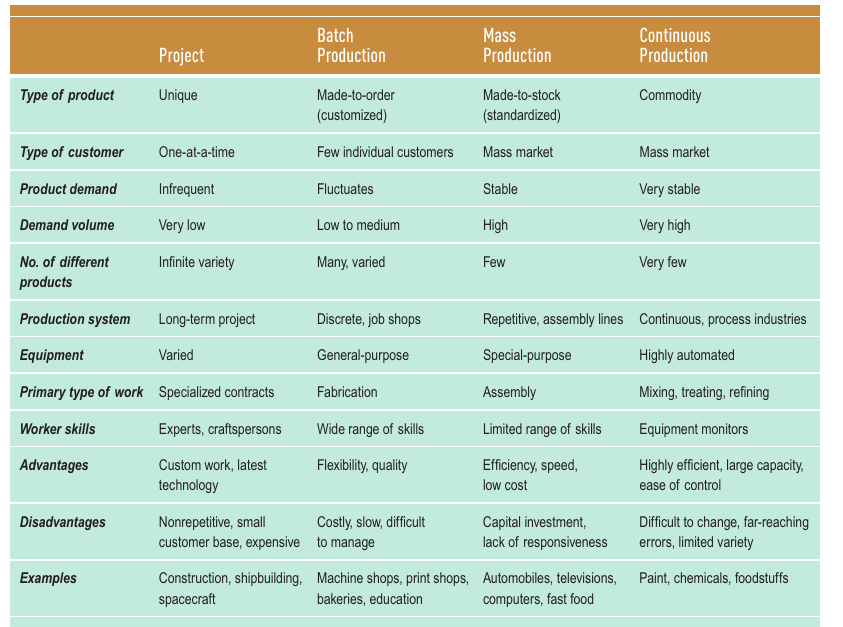
Before choosing how to lay out or manage production, a firm must first decide which kind of production system fits its product. The textbook classifies production processes into four types along a single underlying spectrum: as you move from the first to the last, demand volume increases, products become more standardised, systems become more capital-intensive and automated, and customer involvement decreases.
- Projects: one-at-a-time production of a unique product to customer order — long duration, huge resource commitment, infinite variety (e.g. construction, shipbuilding, spacecraft).
- Batch production: many different jobs processed through the system together in groups, made to customer order, with fluctuating, low-to-medium volume (e.g. machine shops, print shops, bakeries).
- Mass production: large volumes of a standardised product for a mass market, with stable, high demand (e.g. automobiles, televisions, fast food).
- Continuous production: very-high-volume, highly standardised commodity products, produced on a highly automated system that typically runs 24 hours a day (e.g. refined oil, treated water, chemicals).
2Simple Explanation
3Example
4Important Points
- Sequence (low → high volume/standardisation): Project → Batch → Mass → Continuous.
- As you move along this sequence: demand volume ↑, standardisation ↑, capital intensity/automation ↑, flexibility ↓, customer involvement ↓.
- Worker skill requirement is highest for projects (experts/craftspeople) and lowest for continuous production (equipment monitors).
- Equipment moves from "varied" (project) → "general-purpose" (batch) → "special-purpose" (mass) → "highly automated" (continuous).
5Exam-Ready Answer
Production systems can be classified into four types based on product volume and degree of standardisation. Projects involve one-at-a-time production of a unique product to a specific customer order, such as construction or shipbuilding, and require a long duration with specialised, varied equipment and expert labour. Batch production processes many different jobs through the system together in groups, serving fluctuating, low-to-medium volume demand for customised or made-to-order products, as seen in machine shops and bakeries. Mass production manufactures large volumes of a standardised, made-to-stock product for a stable mass market, using special-purpose equipment and workers with a limited range of skills, as in automobile or television manufacturing. Continuous production is used for very-high-volume, highly standardised commodity products such as refined oil or chemicals, using highly automated systems that typically run continuously. Moving from projects to continuous production, demand volume and standardisation increase while flexibility, customisation, and direct customer involvement decrease, and systems become progressively more capital-intensive and automated.
Definition. Production systems are classified by volume and variety. They fall into two broad families — intermittent (project, job shop, batch: start-stop flow, high variety) and continuous (mass, continuous flow: uninterrupted, low variety).
The five systems — this is the table the paper wanted
| System | Definition & characteristics | Example |
|---|---|---|
| Project | A single product made to customer specification. Unique output; higher cost per unit; low automation; highly flexible; needs experts; fixed-position layout; resources brought to the product | Building construction, event management, shipbuilding |
| Job shop | Small-scale production of customised products where each order may differ in specification and process sequence. Functional/process layout (machines grouped by function); high variety, low volume; skilled labour required for flexibility; irregular workflow and longer lead times; high cost per unit but high product differentiation | Tailor-made furniture, machine shops, print shops |
| Batch | Production of a group (batch) of identical products before switching to another batch; each batch passes through stages as a group. Moderate volume and variety; functional layout but better scheduling than job shop; economies of scale within each batch; changeover time needed between batches | Bakery, pharmaceuticals, paint, garments |
| Mass (assembly line) | Large quantities of standardised products using assembly-line techniques; each operation performed continuously at a specific workstation. Product layout (machines in sequence of operations); high volume, low variety; specialised semi-skilled labour; low unit cost from economies of scale | Automobile assembly lines, packaged food, consumer electronics |
| Continuous | Uninterrupted 24×7 production of a commodity; extremely high volume, essentially no variety; highly automated and capital intensive; very low unit cost; very difficult and costly to stop or change | Oil refining, cement, steel, chemicals, power generation |
The pattern that runs across the table
- Moving down: volume rises, variety falls.
- Moving down: unit cost falls, automation rises, labour skill falls, flexibility falls.
- Layout shifts from fixed-position → process → product.
- Equipment shifts from general-purpose → special-purpose.
- Stating this trend explicitly is what turns a list into an analysis.
Intermittent vs continuous — the summary distinction
- Intermittent (project, job, batch): production starts and stops, products differ, routing varies, process layout, higher WIP.
- Continuous (mass, process): production runs uninterrupted, products are standardised, routing is fixed, product layout, low WIP.
Closing line: the choice of production system is not free — it is dictated by the volume and variety the market demands, which is precisely what the product–process matrix maps.
6Possible Exam Questions
- Explain the four types of production systems with examples.
- Compare project, batch, mass, and continuous production on the basis of volume, equipment, and worker skills.
- Classify the following into the appropriate production system, with reasoning: a custom wedding cake, a soft-drink bottling plant, a bridge construction project, a car factory.
7Common Mistakes
- Confusing batch and mass production — the key distinguishing signal is whether demand fluctuates and volume is low-to-medium (batch) versus stable and high (mass), not simply "many units are made" in both.
- ENJob Shop Production, Batch Production, Mass Production & Process Production SystemsEngineer's Academy
- HIProduction Systems – Types | Mass, Batch, Job Shop & Project Type | BBA/MBASonu Singh — PPT wale
- ENTypes of Production (Mass, Flow, Continuous, Batch, Job Shop, Project)Academic Gain Tutorials
- ENTypes of Production SystemsAcademic Gain Tutorials
3. The Product-Process Matrix Core syllabus concept
1Understand the Concept
The product-process matrix (originally developed by Hayes and Wheelwright) is the visual tool that ties the previous concept together: it plots the four production systems (project → batch → mass → continuous, on the vertical "volume" axis) against the degree of product standardisation (horizontal axis, low → high). The central insight is that the best process strategy lies on the diagonal of this matrix — low-volume, low-standardisation products belong with project-type processes; high-volume, highly standardised products belong with continuous processes; and so on down the diagonal.
Companies or products that sit off the diagonal have either made a poor process choice, or have found an unusual way to execute a genuine competitive advantage. The textbook gives both kinds of examples: Motorola using flexible automation to mass-produce customised pagers (off-diagonal, but a competitive strength), versus Corning trying to produce low-volume consumer items using the same continuous glass-forming process built for high-volume items (off-diagonal, and a poor process choice that hurt performance).
2Simple Explanation
3Example
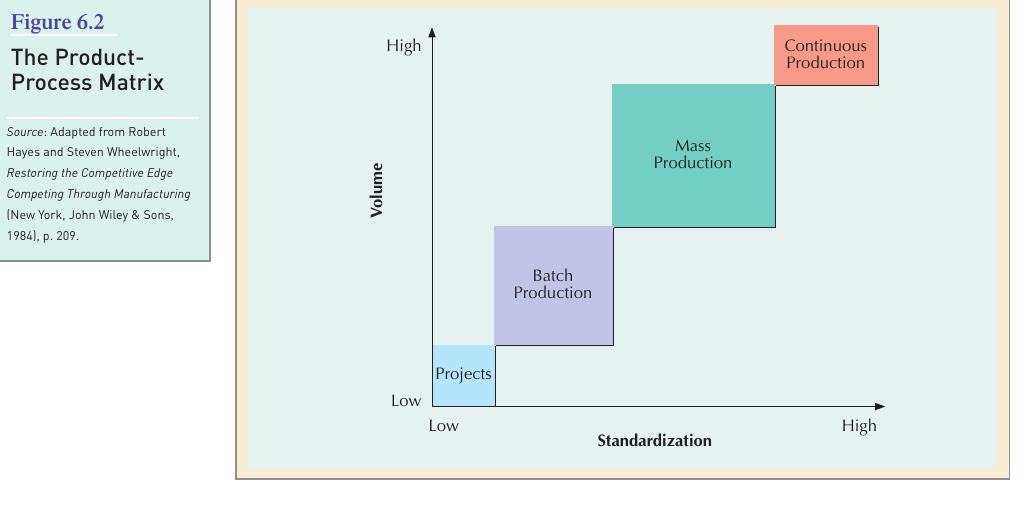
Your lecture PPT extends this into a more detailed five-cluster version — Job Shop, Batch Process, Worker-paced line, Machine-paced line, and Continuous process — mapped against volume/variety, with real examples plotted along the diagonal: surgery (unique, job-shop-like), an executive-shirt maker (batch), Toyota/Toshiba (line-flow, high volume/lower variety), and petroleum products (continuous). It also notes two "non-feasible zones": trying to run very low volume on highly automated fixed capital (utilisation too low to justify the investment), and trying to run very high volume on flexible, general-purpose equipment (unit variable costs too high).
4Important Points
- Axes: Volume (low → high, project → continuous) vs. Standardisation (low → high).
- Best process strategy = on the diagonal.
- Off-diagonal can mean either a poor process choice (Corning) or an unusual competitive advantage achieved through technology (Motorola's mass-customised pagers, Volvo/Rolls-Royce's crafted, customised high-end cars).
- The matrix predicts a natural "drift" over a product's life cycle: as a product matures and volume grows, firms tend to shift from the top-left toward the bottom-right of the matrix.
- Two non-feasible zones exist off the diagonal on either side, driven by underutilised fixed capital or excessive unit variable cost.
5Exam-Ready Answer
The product-process matrix, developed by Hayes and Wheelwright, matches the choice of production process to the two most important product characteristics: demand volume and degree of standardisation. It plots the four production systems — project, batch, mass, and continuous — against increasing volume on one axis and increasing standardisation on the other. The best process strategy lies along the diagonal of the matrix: low-volume, highly customised products are best matched with a project-type process, while high-volume, highly standardised commodity products are best matched with continuous production, with batch and mass production occupying the middle ground. Firms or products positioned off the diagonal have either made a poor process choice — for example, using a rigid continuous process to make a low-volume item — or have achieved an unusual competitive advantage through technology, such as using flexible automation to mass-produce customised products. As a product matures over its life cycle and demand volume grows, firms typically drift down the diagonal from a more flexible, project-like process toward a more standardised, high-volume process.
Definition. The product–process matrix (Hayes & Wheelwright) maps product characteristics (volume and variety) against process structure, showing that each combination has one appropriate process — and that firms should sit on the diagonal.
How the matrix is constructed
- Horizontal axis — product structure, from low volume/high variety (one-of-a-kind) to high volume/low variety (standardised commodity).
- Vertical axis — process structure, from jumbled flow (job shop) through disconnected line (batch) and connected line (assembly) to continuous flow.
- The viable combinations lie on the diagonal running from top-left (project/job shop) to bottom-right (continuous).
What the diagonal means
| Position | Product | Process | Example |
|---|---|---|---|
| Top-left | One-of-a-kind, very low volume | Project / job shop, jumbled flow | Bespoke machinery |
| Upper-middle | Multiple products, low volume | Batch, disconnected line | Bakery, pharma |
| Lower-middle | Few major products, high volume | Assembly line, connected line | Automobiles, appliances |
| Bottom-right | High-volume commodity | Continuous flow | Petroleum, cement, sugar |
The two off-diagonal errors — where the marks are
- Above the diagonal (process too flexible for the volume): using a job shop to produce a high-volume standard product. Result — unnecessarily high unit cost, lost scale economies, a competitor with a line will undercut you.
- Below the diagonal (process too rigid for the variety): using an assembly line for a high-variety, low-volume product. Result — constant changeovers, low utilisation, inability to serve customers who want variety.
- Off-diagonal positions are not automatically wrong, but they must be a deliberate strategic choice with a reason, not an accident of history.
Strategic uses of the matrix
- Diagnosis — plot where you actually are versus where your volume/variety says you should be.
- Life-cycle planning — a product moves down the diagonal as it matures: launched in a job shop at low volume, migrating to batch, then to a line as demand grows. The process must migrate with it.
- Competitive analysis — a rival positioned differently on the matrix competes on a different basis and cannot easily copy you.
Example
- An electric-vehicle startup begins hand-building 200 cars a year (job shop, top-left). At 50,000 cars a year it must have moved to a connected assembly line — a firm that scales its volume without moving down the diagonal ends up above it, with a cost base no mass-market buyer will accept.
Closing line: the matrix's real message is that product and process decisions cannot be taken separately — changing what you sell obliges you to change how you make it.
6Possible Exam Questions
- Explain the product-process matrix with a diagram.
- What does it mean for a firm to be positioned "off the diagonal" of the product-process matrix? Give one example of a good and one example of a poor off-diagonal position.
- A company currently uses batch production for a product whose demand has just become stable and high-volume. What does the product-process matrix suggest it should consider, and why?
7Common Mistakes
- Drawing the matrix with the axes reversed, or mislabelling which corner represents projects vs. continuous production.
- Assuming being off-diagonal is always bad — it can also represent a genuine competitive advantage (mass customisation), which examiners reward you for recognising.
- ENJob Shop, Batch, Mass & Process Production SystemsEngineer's Academy
- ENTypes of Production (Mass, Flow, Continuous, Batch, Job Shop, Project)Academic Gain Tutorials
4. Process Selection with Breakeven Analysis Core syllabus concept
1Understand the Concept
Once a firm knows roughly what kind of process fits its product, it often still has to choose between specific alternative processes — e.g. a more manual, low-investment method versus a more automated, high-investment one. Breakeven analysis is a quantitative technique for making this choice by comparing the cost trade-offs of each alternative at different demand volumes.
The components are volume, cost, revenue, and profit. Cost splits into fixed cost (constant regardless of volume — plant, equipment) and variable cost (varies with volume — labour, material per unit). By setting Total Revenue equal to Total Cost and solving for volume, you find the breakeven point — the volume at which profit is exactly zero. When comparing two processes (say, a manual process with low fixed but high variable cost, versus an automated process with high fixed but low variable cost), setting their two total-cost lines equal to each other identifies the crossover volume above which the higher-fixed-cost/automated process becomes cheaper.
2Formula
3Worked Example Illustrative example — from course lecture PPT
Travis and Jeff want to make and sell stand-up paddle boards at $100 each. Fixed cost = $2,000; variable cost = $50/unit.
They need to sell 40 boards just to break even. Jeff then proposes investing $10,000 in automated equipment that cuts variable cost to $30/unit (still sold at $100). Comparing the two processes' total-cost lines shows a crossover volume above which Jeff's higher-fixed-cost, lower-variable-cost process becomes the cheaper option — the same logic used to decide between manual and automated processes generally.
4When to Use It
Use breakeven analysis whenever choosing between processes (or between making vs. buying) that have different fixed/variable cost structures, and you need to know at what demand volume each option becomes preferable.
5Important Points
- Total Cost = Fixed Cost + (Variable cost per unit × Volume).
- Breakeven volume is where Total Revenue = Total Cost (profit = zero).
- Comparing two processes: the one with higher fixed/lower variable cost becomes preferable only above the crossover volume; below it, the lower-fixed/higher-variable option is cheaper.
- This is a process selection tool, distinct from EOQ-type inventory numericals covered from Unit 8 onward.
6Exam-Ready Answer
Breakeven analysis is a quantitative technique for selecting a production process based on the cost trade-offs associated with different demand volumes. Total cost is divided into a fixed component, which does not change with volume, and a variable component, which changes directly with the number of units produced. The breakeven point is the volume at which total revenue equals total cost, so that profit is exactly zero; it is found by setting price times volume equal to fixed cost plus variable cost times volume, and solving for volume. This technique is particularly useful for comparing two alternative processes with different cost structures — for instance, a manual process with lower fixed cost but higher variable cost per unit, versus an automated process with higher fixed cost but lower variable cost per unit. By comparing the total cost lines of both processes, a firm can identify the crossover volume above which the higher-fixed-cost, more automated process becomes the cheaper option, and below which the lower-fixed-cost process remains preferable, allowing the firm to choose the right process for its expected demand level.
Definition. Process selection by breakeven analysis compares alternative processes on total cost as a function of volume, identifying the indifference volume at which two processes cost the same, and thereby the volume range over which each is preferable.
The underlying trade-off
- More automated / capital-intensive processes have high fixed cost, low variable cost — expensive to install, cheap to run.
- More labour-intensive / general-purpose processes have low fixed cost, high variable cost — cheap to start, expensive per unit.
- Therefore low volume favours low-fixed-cost processes; high volume favours low-variable-cost processes. That single sentence answers most questions on this topic.
How to interpret a set of indifference points
- The output is a decision rule across ranges, not one winner.
- Worked example of the reading: with three processes whose indifference points are at 10,000 and 30,000 units — below 10,000 choose Process A (lowest fixed cost); between 10,000 and 30,000 choose Process B; above 30,000 choose Process C (lowest variable cost).
- Then say why: Process C's heavy fixed cost only repays itself once there are enough units to spread it over.
- If the expected volume is near an indifference point, the decision is fragile — favour the more flexible process, because a forecast error is then cheap.
Assumptions and limitations
- Linear costs — no bulk discounts, no diseconomies, constant variable cost per unit.
- Same selling price and quality from every process — often untrue, since automation may improve consistency.
- Single product; ignores variety and changeover entirely.
- Ignores flexibility, lead time, quality and strategic fit — all of which the product–process matrix does address.
Example
- A packaging firm choosing between manual filling (low fixed, high variable) and an automated line (high fixed, low variable). If forecast volume is 8,000 units against an indifference point of 10,000, manual wins — but if the sales team expects growth to 15,000 next year, the firm should weigh the cost of switching twice against installing automation now.
Closing line: breakeven analysis answers "which process is cheapest at this volume?" — it never answers "which process should we have?", because it is blind to flexibility and strategy.
7Possible Exam Questions
- Explain process selection using breakeven analysis, with the relevant formula.
- Given the fixed cost, variable cost, and selling price of a product, calculate the breakeven volume.
- A firm is deciding between a manual process (lower fixed, higher variable cost) and an automated process (higher fixed, lower variable cost). Explain how it should decide which to use.
8Common Mistakes
- Forgetting that fixed cost does not change with volume — it is a common error to divide fixed cost across units and then treat it as variable.
- Solving for breakeven revenue when the question asks for breakeven volume (units), or vice versa.
- ENTypes of Production SystemsAcademic Gain Tutorials
- ENWhat is Capacity Planning in Operations ManagementDr. Haywood
5. Product-Process Matrix for Services Supporting concept
1Understand the Concept
The original product-process matrix was built for manufacturing. Your course readings folder includes an academic paper (Johansson & Olhager, Int. J. Production Economics, 2006) extending the same underlying logic to service operations and industrial after-sales services. The core idea carries over directly: services, like manufacturing processes, can be positioned on a matrix from "job-shop-like" (highly customised, one-off, low volume — e.g. a specialist consulting engagement) to "line-flow-like" (highly standardised, high volume, low customer contact — e.g. a fast-food counter), and the same diagonal-fit logic applies: a service's process design should match its actual volume and variety of demand.
2Simple Explanation
3Important Points
- Service processes can be classified on a similar spectrum from job-shop-like (low volume, high customisation) to line-flow/continuous-like (high volume, standardised).
- The same diagonal "best fit" principle applies: mismatched service process design (e.g. over-standardising a highly customised service) creates the same kind of poor process choice as in manufacturing.
- This extension is especially relevant when a company bundles a physical good with an after-sales service (e.g. equipment + maintenance contracts), since the two may need different process types even though they relate to the same product.
5Exam-Ready Answer
The product-process matrix framework, originally developed for manufacturing, has also been extended to service operations. Services can similarly be positioned on a spectrum from job-shop-like processes — highly customised, low-volume, high customer-contact services such as specialist consulting — to line-flow or continuous-like processes — highly standardised, high-volume, low customer-contact services such as a fast-food counter or a call centre using scripted responses. As with manufacturing, the best process design for a service lies along the diagonal that matches its actual volume and variety of demand; mismatches, such as over-standardising a service that customers expect to be customised, represent a poor process choice. This extension is particularly relevant for firms that bundle a physical good with an after-sales service, since the two may require different process types even though they are delivered by the same company.
Definition. The service process matrix (Schmenner) classifies services on two dimensions — degree of labour intensity and degree of customisation and customer interaction — producing four service types, each with its own management challenges.
The four service types
| Type | Labour intensity | Customisation / interaction | Examples |
|---|---|---|---|
| Service factory | Low | Low | Airlines, hotels, trucking, resorts |
| Service shop | Low | High | Hospitals, auto repair, restaurants |
| Mass service | High | Low | Retail banking, schools, retail stores |
| Professional service | High | High | Doctors, lawyers, consultants, architects |
The management challenge in each quadrant
- Low labour intensity → capital decisions, technology, capacity scheduling, managing demand peaks against fixed capacity.
- High labour intensity → hiring, training, scheduling and retaining people; managing dispersed sites and service consistency.
- Low interaction/customisation → marketing warmth into a standardised offering; keeping the physical environment attractive; maintaining rigid procedures.
- High interaction/customisation → controlling cost, maintaining quality when every encounter differs, managing customer intervention in the process, and the risk that talent walks out of the door.
How it differs from the manufacturing matrix
- Manufacturing is classified by volume and variety; services by labour intensity and interaction, because the customer is inside the process.
- Services cannot inventory output, so capacity management substitutes for inventory management.
- Quality in services is judged on the process, not only the outcome — the experience of being served is part of the product.
Strategic use
- Firms move quadrants deliberately: online banking moved retail banking from mass service towards service factory by substituting technology for labour.
- Knowing your quadrant tells you which of the four challenge sets to staff and budget for.
Example
- A hospital is a service shop — expensive equipment (low labour intensity relative to capital) but every patient is different (high customisation). Its two hardest problems, predictably, are scheduling scarce equipment and maintaining consistent quality across highly variable cases.
Closing line: the service matrix matters because the operations problems a service faces are determined by its quadrant, not by its industry — a hospital and a car repair shop have more in common operationally than a hospital and a medical school.
6Possible Exam Questions
- Can the product-process matrix be applied to services? Explain briefly with an example.
- ENDifference between Manufacturing and Service OperationsY Lens (Yahkoob Pailippuram)
- ENOperations Management in Goods and ServicesOperations Management 101