Unit 03 — Process Analysis
Mapping a process, and analysing how work actually flows through it — flowcharting, make-to-stock vs make-to-order, buffers, bottlenecks, throughput, and Little's Law.
Bottleneck, throughput, and buffer are defined in your textbook — in Chapter 17's Theory of Constraints section pp. 774–775 — so the exam answers below are grounded there. The specific terms blocking, starving, and Little's Law do not appear in this textbook edition; those three are sourced from your lecture PPT and are labelled as such rather than being presented as textbook content.
1. Process Analysis & Process Flowcharting Core syllabus concept
1Understand the Concept
Before analysing anything, it helps to fix three definitions your lecture material uses precisely Slide 9. A process is a group of related tasks with specific inputs and outputs. Process design concerns which tasks are to be done and how they are coordinated among functions, people, and organisations. Process strategy is an organisation's overall approach for physically producing goods and services — and the textbook adds that a firm's process strategy defines its vertical integration, capital intensity, process flexibility, and customer involvement p. 228.
Process analysis is the systematic examination of every aspect of a process in order to make it faster, more efficient, less costly, or more responsive to the customer p. 235. Before you can improve a process, you first need a precise, shared picture of what actually happens in it — that picture is a process flowchart.
The classic process flowchart uses five standard symbols: a circle (○) for an operation, a square (□) for an inspection, an arrow (⇒) for transportation, a "D" for delay, and an inverted triangle (▽) for storage p. 236. Only the operation symbol represents productive, value-adding work; inspection, transport, delay and storage are the non-productive activities. Precisely because it incorporates these non-productive activities alongside the productive ones, the flowchart can be used to analyse the efficiency of a series of processes, to identify bottlenecks, and as a standardised training and documentation tool p. 238.
The textbook gives a fixed sequence for building one: determine objectives → define process boundaries → define units of flow (patients, products, data) → choose type of chart → observe the process and collect data → map out the process → validate the chart p. 235.
2Simple Explanation
3Example
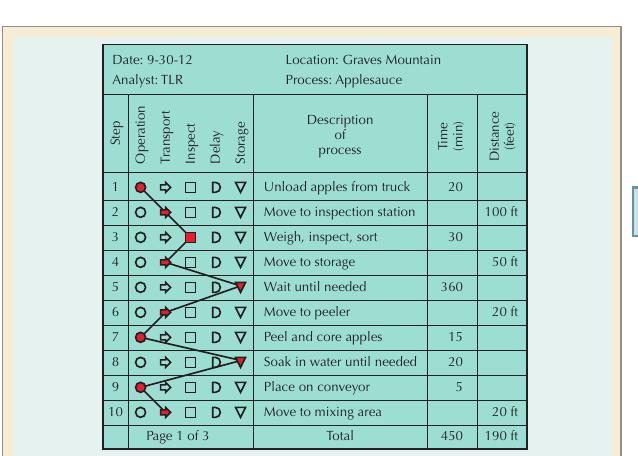
Out of a total process time of 450 minutes for apple processing, only a handful of minutes are actual operations (unloading, weighing, peeling); the rest — 360 minutes of "wait until needed" alone — is delay. That is the entire point of flowcharting: it makes non-value-adding time impossible to ignore.
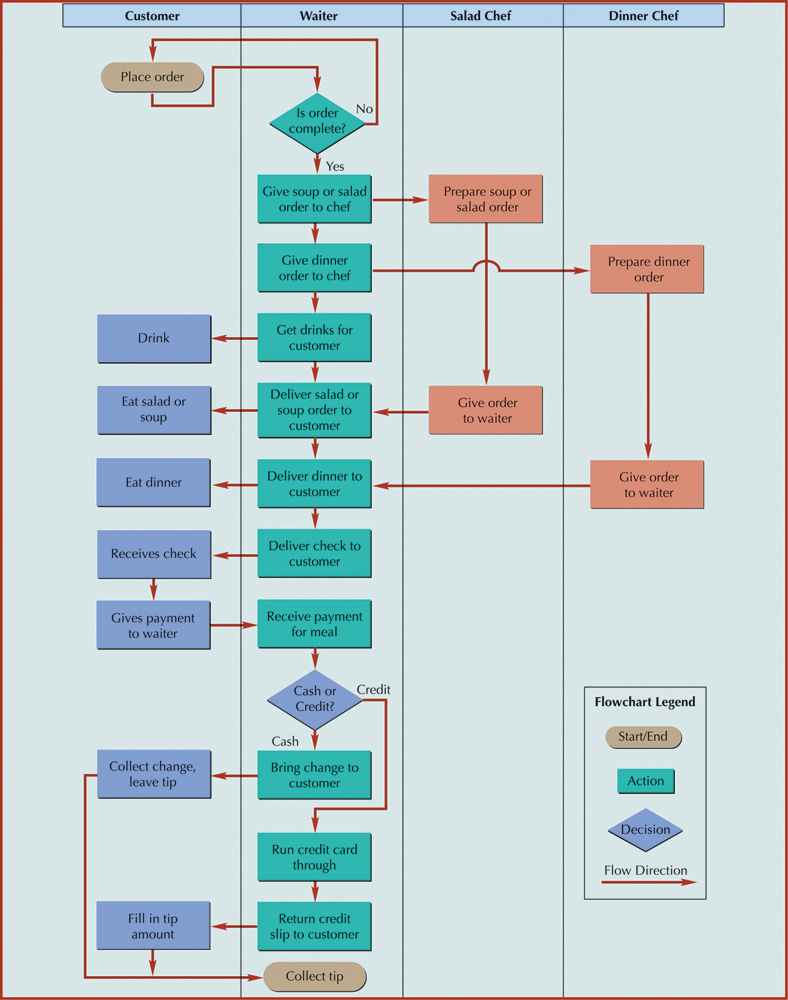
A process map (or swimlane chart) is a second form of flowchart that maps out the activities performed by each different person or department in the process, each in their own lane p. 238:
4Important Points
- Process = related tasks with specific inputs and outputs; process design = what tasks and how coordinated; process strategy = overall approach to physically producing goods/services.
- Five flowchart symbols: Operation (○, the only value-adding one), Inspection (□), Transport (⇒), Delay (D), Storage (▽).
- Flowcharting steps: objectives → boundaries → unit of flow → chart type → observe/collect data → map → validate.
- Uses: analyse efficiency, identify bottlenecks, adjust layouts, document and train, support process innovation and job design.
- A process map / swimlane chart adds who performs each activity, making hand-offs between people or departments visible.
5Exam-Ready Answer
Process analysis is the systematic examination of all aspects of a process in order to improve its operation — to make it faster, more efficient, less costly, or more responsive to the customer. Its basic tools are process flowcharts, diagrams, and maps. A classic process flowchart looks at the manufacture of a product or the delivery of a service from a broad perspective, using five standard symbols: a circle for operations, a square for inspections, an arrow for transportation, a "D" for delays, and an inverted triangle for storage. By incorporating non-productive activities such as inspection, transportation, delay, and storage alongside the productive operations, process flowcharts may be used to analyse the efficiency of a series of processes and to suggest improvements; they also provide a standardised method for documenting the steps in a process and can be used as a training tool, and they allow bottlenecks to be identified so that layouts can be adjusted. Building a flowchart follows a set sequence: determine objectives, define process boundaries, define the units of flow, choose the type of chart, observe the process and collect data, map out the process, and validate the chart. A related tool is the process map or swimlane chart, which maps out the activities performed by each different person or department in the process. Process flowcharts are used in both manufacturing and service operations and are a basic tool for process innovation as well as job design.
Definition. A process is any part of an organisation that takes inputs and transforms them into outputs of greater value. Process analysis is the systematic examination of how that work flows, in order to understand and improve it; process flowcharting is the standard tool for making the flow visible.
Why analyse a process at all
- You cannot improve what you cannot see — flowcharting exposes steps nobody had noticed.
- It locates non-value-added activity: delays, transport, storage, rework.
- It identifies the bottleneck that actually sets output.
- It creates a shared, unambiguous description that different departments can agree on.
The standard flowchart symbols
| Symbol | Activity | Adds value? |
|---|---|---|
| Rectangle / arrow | Operation — work performed on the item | Yes |
| Square | Inspection — checking quality or quantity | No, but often necessary |
| Arrow | Transport — movement between locations | No |
| Inverted triangle | Storage — controlled holding of inventory | No |
| Large D | Delay — waiting, not controlled storage | No |
| Diamond | Decision — the flow branches | — |
Key structural distinctions
- Single-stage vs multi-stage — one operation, or several in sequence with the possibility of buffers between them.
- Serial vs parallel — steps one after another, or duplicated to raise capacity.
- Continuous vs intermittent flow — uninterrupted product movement, versus start-stop batches.
- Value-added vs non-value-added — the split that drives all lean improvement.
Types of processes (by flow structure)
- Project — one-off, unique output; resources brought to the product.
- Job shop — high variety, low volume; process layout; general-purpose equipment.
- Batch — moderate variety and volume; groups of identical units.
- Assembly line / mass — low variety, high volume; product layout; specialised equipment.
- Continuous flow — commodity output, uninterrupted, highly automated.
Example
- Flowcharting a hospital outpatient visit typically shows 12 minutes of consultation (operation) inside 90 minutes of elapsed time — the remaining 78 minutes are queueing (delay) and walking between departments (transport). The chart makes the ratio undeniable, and points improvement at the delays, not at the doctor.
Closing line: flowcharting is not documentation for its own sake — it exists to separate the work that creates value from the time that merely passes.
6Possible Exam Questions
- Explain the symbols used in a process flowchart.
- Describe the steps involved in building a process flowchart.
- Why are inspection, transport, delay, and storage considered non-value-adding, even though they may be necessary?
- What is a process map or swimlane chart? How does it differ from a classic process flowchart?
- Draw and explain a process flowchart for a simple service process of your choice.
7Common Mistakes
- Calling every step "value-adding" — only the operation symbol represents value-adding work.
- Forgetting the final step: validating the chart with a user, expert, or direct observation.
- Confusing a process flowchart (what happens) with a process map (who does it) — mention the swimlane distinction if asked.
- ENCapacity, Throughput, Bottlenecks, and Value Stream AnalysisSupply Chain Insights with Dr. Roscoe
- ENOperations Management with Excel: Bottleneck Analysis Video 1Excel@Analytics — Dr. Canbolat
2. Make-to-Stock vs Make-to-Order Core syllabus concept
1Understand the Concept
Your lecture material opens this unit by asking what actually drives the choice of a process Slide 2: does the company plan to sell large volumes of similar products or small volumes of a variety of products? Does it want to sell customised or standard products? And critically — does it produce after receiving a customer's order, or produce in advance to replenish an inventory from which customers are served?
That last question defines the distinction between two process structures. In a make-to-stock process, the production steps are completed before the customer order arrives; finished goods are held in inventory, and the customer's order is filled from that stock. Because production is decoupled from individual orders, the steps can be run in long, standardised, efficient runs. In a make-to-order process, the customer places the order first and only then does production begin, so every order loops back through the full sequence of steps. This allows genuine customisation, but each order carries the setup and coordination burden individually, which is why the lecture slides label the make-to-order pattern "inefficient operations" and the make-to-stock pattern "efficient operations" in the narrow sense of throughput and cost.
Neither is simply "better" — the right choice follows from what the customer actually wants. Standardised products with predictable demand suit make-to-stock; customised products where variety matters more than speed suit make-to-order. This is the same volume-and-standardisation logic that produces the product-process matrix in Unit 6.
2Simple Explanation
3Example
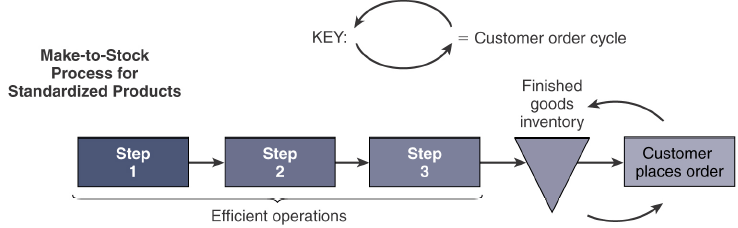
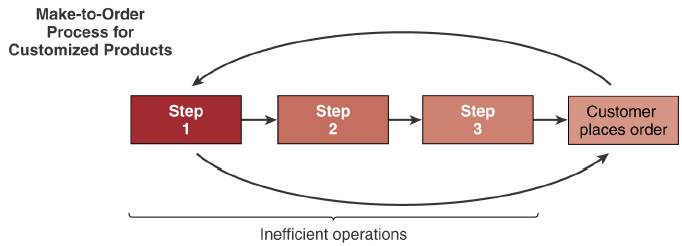
Your lecture applies this directly to hamburger preparation. In the standard method, the customer orders first and the burger is then cooked and assembled to order. At McDonald's, burgers are cooked and assembled into a finished-goods inventory before the customer arrives, and the order is filled from that stock:
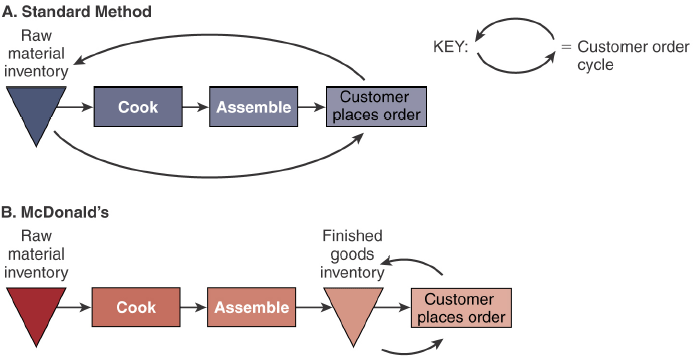
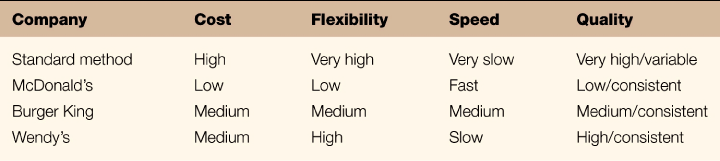
Read across that comparison table and the trade-off becomes explicit: the standard (make-to-order) method achieves very high flexibility and high quality but is very slow and high cost; McDonald's make-to-stock approach is low cost and fast but low flexibility. Burger King and Wendy's sit between the two, trading some speed back for more flexibility.
4Important Points
- Make-to-stock: production completed before the order; finished-goods inventory absorbs demand; efficient, low cost, fast to serve, but low flexibility and requires demand forecasting.
- Make-to-order: order arrives first, then production; highly flexible and customisable, but slower and higher cost per unit.
- The choice depends on volume, standardisation, and whether the customer values customisation or speed.
- The hamburger comparison shows the trade-off is real and graded — firms can deliberately position between the two extremes.
5Exam-Ready Answer
The choice of a process depends on whether the company plans to sell large volumes of similar products or small volumes of a variety of products, whether it sells customised or standard products, and whether it produces after receiving a customer's order or produces in advance to replenish an inventory from which customers are served. This last consideration distinguishes make-to-stock from make-to-order processes. In a make-to-stock process, used for standardised products, all production steps are completed before the customer order arrives and the order is then filled from finished-goods inventory; because production is decoupled from individual orders, operations can be run efficiently at low cost and customers are served quickly, though flexibility is low and demand must be forecast. In a make-to-order process, used for customised products, the customer places the order first and production only then begins, so each order passes through the full sequence of steps; this permits genuine customisation and high quality but is slower and more costly per unit. Hamburger preparation illustrates the contrast: under the standard method the customer orders first and the burger is cooked and assembled to order, giving very high flexibility but very slow service, whereas McDonald's cooks and assembles burgers into a finished-goods inventory in advance and fills orders from that stock, achieving low cost and fast service at the expense of flexibility. Neither approach is inherently superior — the appropriate choice follows from product volume, degree of standardisation, and whether customers value customisation or speed more highly.
Definition. The distinction is about when production is triggered relative to the customer order. Make-to-stock produces to a forecast and serves the customer from finished inventory; make-to-order waits for a confirmed order and then produces. The dividing point is called the customer order decoupling point.
Point of difference — draw this table
| Basis | Make-to-Stock (MTS) | Make-to-Order (MTO) |
|---|---|---|
| Trigger | Forecast of demand | Confirmed customer order |
| Customer waits for | Only delivery — product already exists | Production plus delivery |
| Inventory held as | Finished goods | Raw material and components |
| Variety | Low — standardised range | High — customised |
| Volume | High | Lower |
| Risk carried | Obsolescence and markdown of unsold stock | Lost sales if lead time is too long for the customer |
| Layout suited | Product layout | Process layout |
| Competes on | Cost and immediate availability | Customisation and specification fit |
| Example | FMCG, packaged food, standard footwear | Tailored furniture, industrial machinery, bespoke suits |
The two hybrids worth naming
- Assemble-to-order (ATO) — components are made to stock, final assembly waits for the order. Gives customisation at short lead time. Example: configure-to-order laptops.
- Engineer-to-order (ETO) — even the design begins after the order. Longest lead time, highest customisation. Example: a bespoke industrial plant.
The choice rule — what an application question tests
- Choose MTS when demand is predictable, variety is low, the product is not perishable and customers will not wait.
- Choose MTO when variety is high, the product is expensive to hold, demand is unpredictable, or customers will wait for exactly what they want.
- Choose ATO when customers want variety and speed — the standard modern compromise, achieved through postponement: push the decoupling point as late as possible.
Example
- A restaurant deciding between a buffet (MTS — cooked ahead, instant service, waste risk) and cooked-to-order (MTO — fresh and customised, customer waits). Many resolve it by ATO: prepare components in advance, assemble the dish on order — which is exactly how a fast-casual chain gives you both speed and choice.
Closing line: the real decision is not MTS or MTO but where to place the decoupling point — everything upstream of it runs on forecast, everything downstream on actual demand.
6Possible Exam Questions
- Differentiate between make-to-stock and make-to-order processes with an example.
- What factors should a company consider when selecting a process?
- Explain how McDonald's hamburger process differs from the standard method, and what trade-off it accepts.
- A restaurant wants to reduce customer waiting time without losing its "cooked fresh to order" appeal. Discuss its process options.
7Common Mistakes
- Calling make-to-order simply "worse" — it is slower and costlier, but buys flexibility and customisation, which may be exactly what the customer is paying for.
- Forgetting that make-to-stock requires demand forecasting and carries inventory risk (obsolescence, spoilage).
3. Buffering, Blocking, and Starving Core syllabus concept
1Understand the Concept
Think of any multi-stage process as a chain: Stage 1 finishes a unit of work and passes it to Stage 2. Stages rarely work at exactly the same speed, so something must absorb the mismatch — that something is a buffer: a storage area between two stages where the output of the upstream stage is placed prior to being used in a downstream stage.
The textbook defines the buffer in exactly this role within the Theory of Constraints: in the drum-buffer-rope concept, "the buffer is inventory placed in front of the bottleneck to ensure it is always kept busy" p. 775. The buffer exists because the bottleneck's output determines the output of the whole system, so the bottleneck must never be left waiting for work.
A buffer solves the mismatch only up to a point. If the buffer between Stage 1 and Stage 2 fills up because Stage 2 is slower, Stage 1 has nowhere to put its finished output and must stop — this is blocking: activities in a stage must stop because there is no place to deposit the item. The mirror image is starving: activities in a stage must stop because there is no work available. Both are symptoms of imbalance between connected stages, and both point directly at the bottleneck.
The words blocking and starving are your lecture's terminology and do not appear in this textbook edition; the underlying buffer/bottleneck mechanism they describe is textbook material.
2Simple Explanation
3Example
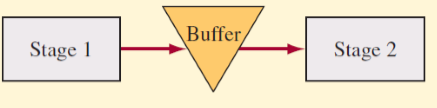
On a sandwich line, the toasting stage can hold only 4 slices at a time (its buffer). If the filling stage downstream is slow, the buffer fills with toasted bread that has nowhere to go — the toasting stage is blocked and must stop. If instead toasting is the slow stage and runs out of toasted bread for filling to use, the filling stage is starved and sits idle.
4Important Points
- Buffer = storage between two stages holding output before it is used downstream; in TOC it is placed in front of the bottleneck to keep it always busy.
- Blocking = a stage must stop because there is no place to deposit its finished item (downstream buffer full).
- Starving = a stage must stop because there is no work available (upstream buffer empty).
- Both are caused by speed mismatch between connected stages, and both point to a bottleneck.
5Exam-Ready Answer
In a multistage process, a buffer is a storage area between two stages where the output of one stage is placed prior to being used in a downstream stage. Buffers exist because connected stages rarely operate at exactly the same speed, and in the theory of constraints a buffer is deliberately placed in front of the bottleneck as inventory that ensures the bottleneck is always kept busy — necessary because the output from the bottleneck determines the output, or throughput, of the whole system. Blocking occurs when the activities in a stage must stop because there is no place to deposit the completed item, that is, the buffer ahead of it is full because the next stage is slower. Starving occurs when the activities in a stage must stop because there is no work available, that is, the buffer behind it is empty because the previous stage is slower. Both blocking and starving are therefore symptoms of imbalance between successive stages of a process, and both indicate the presence of a bottleneck, since the slowest stage in a sequence is what causes the stages around it to alternately block or starve.
Definition. These three terms describe what happens between the stages of a multi-stage process when their rates do not match. A buffer is storage placed between stages; blocking and starving are the two failures that occur when a buffer is absent or empty.
The three terms — define each precisely
| Term | Definition | Which stage stops |
|---|---|---|
| Buffering | A storage area between stages, where the output of one stage is placed before it is used by the next | Neither — that is the point of it |
| Blocking | The activities in a stage must stop because there is nowhere to put the item just completed | The upstream stage — it has work but no space |
| Starving | The activities in a stage must stop because there is no work to do | The downstream stage — it has space but no work |
How to keep them straight
- Blocked = full ahead of you. You finished, the next stage is busy, the buffer is full, so you must stop.
- Starved = empty behind you. You are free, but nothing has arrived, so you must stop.
- Both are idle time caused by imbalance, not by any stage being slow in itself.
What buffers actually do
- Decouple adjacent stages so a stoppage in one does not immediately halt the other.
- Absorb variability in processing times and small breakdowns.
- Raise utilisation and throughput of the line as a whole.
- But: buffers cost money as work-in-process inventory, lengthen flow time (Little's Law), take floor space, and — the lean objection — hide the underlying problems they compensate for.
Example
- A car wash with wash → dry → polish. If the polisher is slow, the dryer finishes a car with nowhere to send it and is blocked. If the washer breaks down, the dryer sits with nothing arriving and is starved. A short queueing lane between them (buffer) absorbs both.
Closing line: blocking and starving are symptoms of an unbalanced line — a buffer treats the symptom, line balancing treats the cause.
6Possible Exam Questions
- Define buffering, blocking, and starving with a suitable example.
- How are blocking and starving related to the concept of a bottleneck?
- Why is a buffer placed in front of the bottleneck rather than elsewhere in the process?
- A production line's Stage 2 is frequently idle waiting for parts from Stage 1. Identify and explain the phenomenon.
7Common Mistakes
- Swapping the two definitions. Remember: Blocking = backed up, can't discharge output; Starving = nothing to start with.
- ENCapacity, Bottlenecks & Utilization Explained — Operations ManagementOperations & Supply Chain Management University
- ENCapacity, Throughput, Bottlenecks, and Value Stream AnalysisSupply Chain Insights with Dr. Roscoe
4. Bottleneck, Throughput, and Utilization Core syllabus concept
1Understand the Concept
Every process is a series of stages, each with its own capacity — the number of units it can process per unit of time. The bottleneck is the stage with the lowest capacity, and it matters because, as the textbook puts it, manufacturing resources are typically not used evenly; most systems are inherently unbalanced, and the flow through the system is controlled by the bottleneck resource p. 774.
The single most quotable consequence, straight from the textbook: an hour's worth of production lost at a bottleneck reduces the output of the system by the same amount of time, whereas an hour lost at a non-bottleneck may have no effect on system output p. 774. This is why speeding up a non-bottleneck stage does nothing for overall output — only relieving the bottleneck does. It also follows that the bottleneck should always have material to work on, should spend as little time as possible on non-productive activities such as setups and waiting, should be fully staffed, and should be the focus of improvement or automation efforts.
Throughput is the output of the system, and the textbook states directly that "output from the bottleneck determines the output or throughput of the system" p. 775. Your lecture adds the rate-based phrasing: the average flow rate through the system is the throughput rate, measured as jobs per unit time; in a stable environment the average inflow rate equals the average outflow rate Slide 36.
Utilization measures how much of a resource's available capacity is actually being used: actual output divided by capacity Slide 45.
2Simple Explanation
3Example
Bottleneck: Patties cook 20 at a time on a stove in 60 seconds → stove capacity = 20 burgers/min. Ten workers each assemble a burger in 27 seconds → assembly capacity = 10 ÷ (27/60) ≈ 22.2 burgers/min. Since 20 < 22.2, the stove is the bottleneck and caps the whole process at 20 burgers/min, even though assembly could do more. Hiring an eleventh assembly worker would not raise output at all.
Utilization: A Starbucks cashier has capacity 96 customers/shift but actually serves 72. Utilization = 72/96 = 0.75 — busy 75% of the shift, idle 25%.
4Important Points
- Bottleneck = the stage with lowest capacity; flow through the system is controlled by it.
- An hour lost at the bottleneck costs the system an hour of output; an hour lost at a non-bottleneck may cost nothing.
- The bottleneck should always have material, minimise setups/waiting, be fully staffed, and be the focus of improvement.
- Throughput = the system's output, determined by the bottleneck. Throughput rate = jobs per unit time; at steady state, inflow rate = outflow rate.
- Utilization = actual output ÷ capacity.
- To find the bottleneck, express every stage's capacity in the same units and take the smallest.
5Exam-Ready Answer
Manufacturing resources are typically not used evenly, and most systems are inherently unbalanced, so rather than trying to balance the capacity of every stage, attention is directed at balancing the flow of work through the system. Resources are accordingly identified as either bottleneck or non-bottleneck, and the flow through the system is controlled by the bottleneck resource — the stage with the lowest capacity. The practical significance is that an hour's worth of production lost at a bottleneck reduces the output of the system by that same amount of time, whereas an hour lost at a non-bottleneck may have no effect on system output at all. It follows that the bottleneck should always have material to work on, should spend as little time as possible on non-productive activities such as setups and waiting for work, should be fully staffed, and should be the focus of improvement or automation efforts. Throughput is the output of the system, and it is the output from the bottleneck that determines it; the throughput rate expresses this as the average number of jobs flowing through the system per unit of time, which in a stable process equals both the average inflow and average outflow rate. Utilization measures how effectively a resource's available capacity is being used, calculated as actual output divided by capacity. For example, if a stove can cook 20 burgers per minute while assembly can handle 22.2 per minute, the stove is the bottleneck and limits the whole process to 20 burgers per minute, so adding assembly workers would not increase output — only adding cooking capacity would.
Definition. The bottleneck is the stage in a process with the lowest capacity — it sets the output rate of the entire process. Throughput rate is the output per unit of time actually achieved. Utilisation is the ratio of the time a resource is actually used to the time it is available.
The governing principle
- The bottleneck determines the throughput of the whole process, no matter how fast the other stages are.
- An hour lost at the bottleneck is an hour lost for the entire system; an hour lost at a non-bottleneck costs nothing.
- Therefore: improve the bottleneck, not the fastest stage. Speeding up a non-bottleneck only builds inventory in front of the bottleneck.
- Non-bottleneck stages will always have utilisation below 100% — and that is correct, not wasteful. Driving every station to full utilisation just creates WIP.
How to identify the bottleneck
- The stage with the longest processing time per unit (lowest capacity per hour).
- The stage with work piling up in front of it and idle time behind it.
- The stage running closest to 100% utilisation.
How to relieve a bottleneck
- Add capacity — another machine or shift at that stage.
- Move work off it to a non-bottleneck stage.
- Reduce setup and changeover time at that stage.
- Ensure it never starves — buffer immediately upstream of it.
- Improve quality upstream so the bottleneck never processes a unit that will later be scrapped.
Note: relieving one bottleneck moves it somewhere else — bottleneck management is continuous, which is the core of Goldratt's Theory of Constraints.
Example
- A sandwich shop: order taking 20 sec/customer, assembly 60 sec, payment 25 sec. Assembly is the bottleneck, so throughput is one customer per 60 seconds = 60/hour — regardless of how fast the till is. Adding a second till changes nothing; adding a second assembler nearly doubles output.
Closing line: capacity of a process is never the sum of its stages — it is the capacity of its weakest stage, which is why bottleneck identification is the first step in any process improvement.
6Possible Exam Questions
- Define bottleneck, throughput, and utilization, and explain how they are related.
- Given the processing capacities of several stages, identify the bottleneck and justify your answer.
- "An hour lost at a bottleneck is an hour lost for the entire system." Explain this statement.
- Why should improvement and automation efforts be focused on the bottleneck resource?
- Explain the managerial implications of a resource operating at low utilization.
7Common Mistakes
- Comparing capacities in mismatched units (seconds per unit vs units per minute) — convert to a common rate first.
- Assuming the busiest-looking stage is the bottleneck; it must be identified by capacity calculation.
- Recommending improvement at a non-bottleneck stage — the textbook's central point is that this yields no system gain.
- ENCapacity, Bottlenecks & Utilization Explained — Operations ManagementOperations & Supply Chain Management University
- ENCapacity, Throughput, Bottlenecks, and Value Stream AnalysisSupply Chain Insights with Dr. Roscoe
- ENOperations Management with Excel: Bottleneck AnalysisExcel@Analytics — Dr. Canbolat
5. Measuring Process Performance Supporting concept
1Understand the Concept
Your lecture material defines a precise vocabulary for talking about time inside a process Slides 38–39. These terms come up constantly in process-analysis questions, and using them accurately is exactly what marks out a strong answer:
- Efficiency — the ratio of the actual output of a process relative to some standard; alternatively used to measure the loss or gain in a process.
- Setup time — the time required to prepare a machine to make a particular item.
- Run time — the time required to produce a batch of parts.
- Operation time — the sum of setup time and run time for a batch of parts run on a machine.
- Flow time — includes the time a unit spends actually being worked on together with the time it spends waiting in a queue. (In practice the term cycle time is often used loosely to mean flow time, though in line balancing "cycle time" has a stricter meaning — see Unit 5.)
- Value-added time — the time in which useful work is actually being done on the unit.
- Process velocity (also called the throughput ratio) — the ratio of value-added time to flow time.
Process velocity is the most revealing of these: it exposes what fraction of the total time a unit spends in the system is actually being worked on, versus merely waiting. The apple-processing flowchart in Concept 1 is a vivid illustration — 450 minutes of flow time containing only a few minutes of genuine value-added operations gives an extremely low process velocity.
2Simple Explanation
3Formula
4Important Points
- Flow time = processing time + queue/waiting time; value-added time excludes all waiting.
- Setup time is often not included when computing the utilization of a process.
- A low process velocity signals that most of a job's time in the system is spent waiting — a prime improvement target.
- Reducing flow time (waiting) raises process velocity without changing the actual work content.
5Exam-Ready Answer
Several standard measures are used to assess process performance. Efficiency is the ratio of the actual output of a process relative to some standard, and may alternatively be used to measure the loss or gain in a process. Setup time is the time required to prepare a machine to make a particular item, while run time is the time required to produce a batch of parts; the sum of the two is the operation time for that batch on the machine. In practice, setup time is often not included when computing the utilization of a process. Flow time includes the time a unit spends actually being worked on together with the time it spends waiting in a queue, and is frequently referred to as cycle time. Value-added time is the time in which useful work is actually being done on the unit. The ratio of value-added time to flow time is called process velocity, or the throughput ratio, and is a particularly useful measure because it reveals what proportion of a unit's total time in the system is genuinely productive rather than spent waiting. A low process velocity therefore identifies waiting time as the dominant improvement opportunity, since reducing queueing raises process velocity without altering the actual work content of the job.
Definition. Process performance is measured by a small set of related metrics that together describe how fast work moves, how much of that time adds value, and how well capacity is used.
The core measures
| Measure | Definition | What it tells the manager |
|---|---|---|
| Flow time (throughput time, cycle time) | Total elapsed time a unit spends in the process, from entry to exit — including all waiting | What the customer actually experiences as lead time |
| Value-added time | The portion of flow time spent on activities the customer would pay for | How much of the wait is genuinely productive |
| Process velocity (throughput ratio) | Flow time ÷ value-added time | How much waste there is; ideal is 1, real processes are far higher |
| Throughput rate | Units completed per unit of time | Output capability — set by the bottleneck |
| Cycle time (of a line) | Time between successive completed units | The line's pace; determines whether takt is met |
| Utilisation | Time used ÷ time available | Whether resources are busy — but high is not always good |
| Productivity | Output ÷ input | Efficiency of resource conversion |
| Efficiency | Actual output ÷ standard or design output | Performance against the plan |
How to interpret them — the application skill
- A high process velocity ratio (say 20) means only 5% of the customer's wait is value-adding — the improvement target is the other 95%, not the work itself.
- High utilisation with long flow time is the classic warning sign: resources are busy because inventory is queueing, not because output is high.
- Throughput and flow time are linked through Little's Law — you cannot change one without changing WIP or the other.
- Measure at the bottleneck: it is the only station whose utilisation genuinely constrains output.
Example
- An insurance claim takes 10 working days to settle, of which actual assessment work is 4 hours. Flow time = 80 hours, value-added time = 4 hours, process velocity = 20. The insurer's improvement effort should target the 76 hours of queueing, not try to make assessors faster.
Closing line: these measures matter because they distinguish being busy from being fast — and customers only ever experience the second.
6Possible Exam Questions
- Define flow time, value-added time, and process velocity.
- Differentiate between setup time, run time, and operation time.
- What does a low process velocity indicate about a process, and how would you improve it?
7Common Mistakes
- Treating flow time as processing time only — it explicitly includes queue/waiting time.
- Using "cycle time" loosely in a line-balancing question, where it means the maximum time allowed at a workstation, not flow time.
- ENLittle's Law Explained — Throughput, Flow Time & WIPOperations & Supply Chain Management University
- ENCapacity, Bottlenecks & Utilization ExplainedOperations & Supply Chain Management University
6. Little's Law Core syllabus concept
1Understand the Concept
Little's Law connects three basic measures of any process: how much work is sitting inside it, how fast work moves through it, and how long each unit spends inside it. Your lecture states it as a long-term relationship among inventory, throughput, and flow time Slide 47:
Rearranged: Flow Time = WIP / Throughput Rate, and Throughput Rate = WIP / Flow Time. The relationship holds for any stable process — a factory, a bank queue, a hospital, a warehouse — regardless of what happens inside it, which is what makes it so useful: measure any two of the three quantities and the third follows.
The managerial implication your lecture draws out Slide 52: WIP and throughput rate are both relatively easy to measure, so flow time can be calculated rather than timed directly; and holding WIP fixed, reducing flow time results in a higher throughput rate. This is a core justification for attacking waiting and work-in-process — they convert directly into capacity without new resources.
Little's Law is not covered in this edition of the Russell & Taylor textbook; it is your lecture's material, and the exam answer below is written from that source.
2Simple Explanation
3Example
Bank teller: average WIP = 6 customers; throughput rate = 12 customers/hour. Flow (throughput) time = 6 / 12 = 0.5 hours — a customer spends 30 minutes in the bank on average.
Restaurant: average 50 customers inside; 30 customers arrive and leave per hour. Flow time = 50 / 30 ≈ 1.67 hours (1 hr 40 min) per customer — a long dwell time that signals slow table turnover worth investigating.
4Important Points
- Formula: WIP = Throughput Rate × Flow Time.
- Holds for any stable process, regardless of internal detail.
- WIP and throughput rate are easy to measure; flow time can therefore be derived rather than timed.
- With WIP held constant, reducing flow time raises the throughput rate.
- All three quantities must use consistent time units.
5Exam-Ready Answer
Little's Law states that there is a long-term relationship among inventory, throughput, and flow time in any stable process: Inventory (work-in-process) equals the throughput rate multiplied by the flow time, or equivalently, flow time equals average work-in-process divided by the throughput rate. Because the relationship holds regardless of what happens inside the process, it applies equally to manufacturing systems, service queues, and warehouses, and only two of the three quantities need to be measured for the third to be calculated. For example, if a bank has an average of 6 customers in it and serves 12 customers per hour, the average time a customer spends in the bank is 6 divided by 12, or 0.5 hours. Its practical significance lies in two implications: work-in-process and throughput rate are relatively easy to measure, so flow time can be derived rather than observed directly; and while holding work-in-process constant, reducing flow time results in a higher throughput rate. Reducing waiting time and work-in-process therefore increases the effective capacity of a process without requiring additional resources.
Definition. Little's Law states that the average inventory in a process equals the average throughput rate multiplied by the average flow time. It holds for any stable process, regardless of the arrival pattern, service distribution or queue discipline — which is what makes it so widely usable.
What each term means
- I — Inventory / WIP: the average number of units inside the process at any moment (customers in the shop, claims in the system, cars on the line).
- R — Throughput rate: the average rate at which units leave the process (units per hour).
- T — Flow time: the average total time a unit spends inside the process, waiting included.
The relationship between the three — what an application question tests
- The three are locked together: fix any two and the third is determined. You cannot independently choose all three.
- To reduce flow time you must either reduce WIP or increase throughput. There is no third option.
- Adding WIP does not add output — if throughput is fixed by the bottleneck, extra WIP only lengthens flow time. This is the formal argument against releasing more work into a busy system.
- It explains why lean cuts WIP: at constant throughput, halving WIP halves customer lead time.
Where firms apply it
- Estimating lead time quoted to a customer, from observed WIP and output rate.
- Sizing a queue or waiting area — how many customers will be present on average.
- Setting WIP caps (Kanban limits) to hit a target lead time.
- Diagnosing: if flow time is rising while output is flat, WIP has grown — look for a bottleneck.
Example (reading a value, not solving)
- A bank branch serves 30 customers/hour and there are on average 15 customers inside. Then flow time = 15 ÷ 30 = 0.5 hour = 30 minutes. If the manager wants a 15-minute wait without hiring, the only lever left is to halve the number of customers in the system — by appointment scheduling or by diverting transactions to an app.
Closing line: Little's Law is powerful because it needs no assumptions about the process — it tells you that lead time is a consequence of WIP and throughput, not an independent target you can simply promise.
6Possible Exam Questions
- State and explain Little's Law with an example.
- Given the average WIP and throughput rate of a system, calculate the average flow time.
- Explain how reducing flow time can increase throughput rate, using Little's Law.
- A restaurant's customers spend an average of 1 hour 40 minutes inside. Apply Little's Law to diagnose the problem.
7Common Mistakes
- Mixing inconsistent time units (per-hour throughput with per-day WIP).
- Rearranging the formula incorrectly — write WIP = Rate × Time first, then solve for the unknown.
- ENLittle's Law Explained — Throughput, Flow Time & WIPOperations & Supply Chain Management University
- ENLittle's Law Explained: The Formula That Drives Lean Flow and Lead TimeLeanVlog