Unit 07 — Inventory Management
Why firms hold inventory, what it costs, how it's controlled, and how to prioritise attention across thousands of items.
1. What Is Inventory & Why Hold It Core syllabus concept
1Understand the Concept
Inventory is a stock of items an organisation keeps on hand to meet internal or external demand. It is easy to think of inventory only as finished products waiting to be sold, but in a manufacturing firm it also includes raw materials, purchased parts and supplies, partially completed work-in-process (WIP), items currently being transported, and even tools and equipment.
Why hold inventory at all, if it costs money to carry? The textbook gives several genuine business reasons, all of which come down to managing uncertainty and mismatches in timing: demand is rarely known with total certainty, so a safety stock buffers against unexpected spikes; demand can be seasonal or cyclical, so firms build up inventory during slow periods to meet a predictable future surge (e.g. toy manufacturers stocking up for the holiday season); inventory provides independence from vendors whose deliveries might be late or inconsistent; buying in bulk lets a firm take advantage of price/quantity discounts; and holding buffer inventory between stages of a production process prevents a hiccup at one stage (a machine breakdown) from stopping the entire line.
2Simple Explanation
3Example
Toy manufacturers deliberately build up inventory throughout the summer and fall, even though demand is low at that time, because they know demand will spike sharply during the holiday season and they lack the production capacity to make that entire volume in a short window. This is a direct example of inventory absorbing seasonal demand.
4Important Points
- Types of inventory: raw materials, purchased parts/supplies, work-in-process (WIP), items in transit, tools/equipment, finished goods.
- Reasons to hold inventory: meet uncertain/seasonal demand, independence from vendors, take advantage of price discounts, provide independence between production stages (avoid work stoppages).
- Inventory management = deciding how much to order and when to order — the two questions every model in Units 8–9 ultimately answers.
5Exam-Ready Answer
Inventory is a stock of items an organisation keeps on hand to meet internal or external customer demand, and can take the form of raw materials, purchased parts, work-in-process, items in transit, tools and equipment, or finished goods. Firms hold inventory for several reasons: because demand is rarely known with certainty, requiring a safety stock to guard against stockouts; to meet seasonal or cyclical demand that current production capacity could not otherwise satisfy in time; to maintain independence from vendors whose deliveries may be delayed or inconsistent; to take advantage of price or quantity discounts available on larger orders; and to provide independence between successive stages of a production process, so that a temporary breakdown or delay at one stage does not halt the entire operation. The central purpose of inventory management is therefore to determine how much to order and when to order, balancing the benefits of holding stock against the cost of carrying it.
Definition. Inventory is the stock of any item or resource used in an organisation — raw materials, work-in-process, finished goods, and maintenance/repair/operating (MRO) supplies. Inventory management is the set of policies that decide what to stock, how much, and when to reorder.
The four types of inventory
- Raw materials — inputs purchased but not yet processed.
- Work-in-process (WIP) — partly completed units inside the process.
- Finished goods — completed units awaiting sale or shipment.
- MRO supplies — maintenance, repair and operating items that support production without entering the product.
Why firms hold inventory — the functions
- Meet anticipated demand — serve customers immediately rather than making them wait.
- Decouple stages of production so a stoppage at one does not halt the next.
- Buffer against uncertainty in demand and in supplier lead time (safety stock).
- Smooth production against seasonal or fluctuating demand.
- Obtain quantity discounts and lower ordering/transport cost per unit.
- Hedge against price increases or expected shortages.
- Cover transit — pipeline stock in transport is inventory too.
Role of inventory in the supply chain
- Inventory exists at every stage — supplier, manufacturer, distributor, retailer — and is the buffer between them.
- It is the main lever on the trade-off between responsiveness and efficiency: more inventory means faster service and higher cost.
- Poor coordination produces the bullwhip effect — small demand variations at the retail end amplify into large swings upstream.
Why inventory planning, ordering, storage and control matter (the FMCG question)
- Planning — ensures sufficient stock for high, fluctuating consumer demand; avoids stockouts causing lost sales and dissatisfaction; optimises working capital by balancing investment against turnover.
- Ordering — determines when and how much to order for smooth production and distribution; reduces ordering cost and prevents overstocking; supports just-in-time approaches.
- Storage — keeps products safe and organised to protect quality; enables fast retrieval for distribution to retail outlets; minimises spoilage and obsolescence, critical for perishable FMCG goods.
- Control — tracks stock levels using ERP systems; identifies fast- and slow-moving items for better decisions; reduces carrying cost and improves operational efficiency.
Closing line: inventory is simultaneously an asset on the balance sheet and a symptom of uncertainty in the process — the goal is not to eliminate it but to hold the smallest amount that still protects service.
6Possible Exam Questions
- Define inventory. What are the different types of inventory held by a manufacturing firm?
- Explain the reasons why organisations hold inventory.
- A retailer stocks up heavily before a festival season despite the extra carrying cost. Explain this decision using inventory management concepts.
7Common Mistakes
- Limiting the definition of inventory to "finished goods only" — remember raw materials, WIP, in-transit items, and even tools/equipment all count.
- ENInventory Management Explained: Concepts, Types, and CostsOperations & Supply Chain Management University
- HIInventory Management in Hindi — Concept, Importance, Types, Models/Techniques | BBA/MBASonu Singh — PPT wale
- ENLecture 13: Inventory ManagementEddy Witzel
2. Dependent vs Independent Demand Core syllabus concept
1Understand the Concept
Every inventory item's demand is driven by one of two fundamentally different sources. Dependent demand items are components or materials whose demand is derived from the production of another item — you don't forecast the demand for these directly; you calculate it from the production plan of the item they go into. Independent demand items are finished products demanded directly by external customers, driven by market conditions outside the firm's control, and therefore genuinely need to be forecast.
2Simple Explanation
3Example
If an automobile company plans to produce 1,000 new cars, it will need roughly 5,000 wheels and tyres (including spares) — the demand for tyres is entirely dependent on the production plan for cars. The cars themselves, however, are bought directly by customers, so their demand is independent and must be forecast from the market.
4Important Points
- Dependent demand: derived from production of another item; calculated, not forecast (e.g. components, raw materials for a specific product).
- Independent demand: driven by external market conditions; must be forecast (e.g. finished products, retail goods).
- The EOQ-family models in Units 8–9 are built primarily for managing independent demand items.
5Exam-Ready Answer
Demand for inventory items is classified as either dependent or independent. Dependent demand items are typically component parts or raw materials whose demand is derived from the production of a final product, so their required quantity can be calculated directly from the production plan rather than forecast separately — for example, the demand for tyres depends directly on how many cars a company plans to produce. Independent demand items are finished products demanded by external customers and driven by market conditions beyond the firm's direct control, such as cars, appliances, or retail goods, and therefore must be estimated through demand forecasting. This distinction matters because different inventory management techniques are appropriate for each: independent demand items are typically managed using order-quantity models such as EOQ, while dependent demand items are more efficiently managed through techniques like material requirements planning that calculate exact component needs from the parent item's production schedule.
Definition. Independent demand for an item arises directly from the market and must be forecast. Dependent demand is derived from the demand for some other item and can therefore be calculated exactly.
Point of difference — draw this table
| Basis | Independent demand | Dependent demand |
|---|---|---|
| Source of demand | External — the market and end customers | Internal — derived from demand for a parent item |
| How it is determined | Forecast, using historical data | Calculated from the bill of materials and production schedule |
| Uncertainty | High — forecasts are always wrong | Low — known once the parent schedule is fixed |
| Demand pattern | Relatively continuous and smooth | Lumpy — arrives in discrete batches when a run is scheduled |
| Typical items | Finished goods, spare parts sold to customers | Raw materials, components, sub-assemblies |
| Planning system | EOQ, reorder point, safety stock — statistical replenishment | MRP — schedule-driven, ordered only when needed |
| Safety stock | Needed, because demand is uncertain | Minimal, because requirement is known |
| Example | Demand for finished bicycles | Demand for the two tyres each bicycle requires |
Why the distinction matters
- It determines which planning system to use — statistical reorder-point methods for independent items, MRP for dependent ones.
- Applying reorder-point logic to a dependent item causes excess stock, because it holds safety stock against a requirement that is actually known.
- A single item can be both: a tyre is dependent demand for the assembly line and independent demand as a spare sold to customers — and the two streams should be planned differently.
Example
- A car plant forecasts demand for the finished car (independent). Once it schedules 1,000 cars, the requirement for 5,000 wheels is not a forecast at all — it is arithmetic (dependent). Holding safety stock of wheels "just in case" is pure waste.
Closing line: the rule is simple — forecast what the market decides, calculate what your own schedule decides.
6Possible Exam Questions
- Differentiate between dependent and independent demand with examples.
- Why must independent demand be forecast while dependent demand can be calculated?
7Common Mistakes
- Assuming raw materials are always dependent demand — this is only true when the raw material is tied to a specific parent product's production plan; a hardware store's stock of nails sold directly to customers is independent demand.
- ENInventory Management Explained: Concepts, Types, and CostsOperations & Supply Chain Management University
- ENLecture 13: Inventory ManagementEddy Witzel
3. Inventory Costs Core syllabus concept
1Understand the Concept
Every inventory decision is ultimately a balancing act between three costs that pull in different directions. Carrying (holding) cost is the cost of keeping an item in stock — storage/rent, insurance, material handling, spoilage/obsolescence, and the opportunity cost of capital tied up in inventory; it grows linearly with how much inventory you hold, and typically runs 10–40% of an item's value per year. Ordering cost is the cost of placing and receiving a replenishment order — paperwork, transportation, receiving, inspection; it is roughly fixed per order and doesn't depend on order size, so ordering more often (smaller batches) increases total ordering cost. Shortage (stockout) cost is the cost of not having enough inventory to meet demand — lost sales, lost customer goodwill, and (for internal demand) production downtime.
These three costs are naturally in tension: ordering larger, less-frequent batches reduces ordering cost but increases carrying cost (more average inventory sitting around); ordering smaller, more-frequent batches does the reverse. This exact tension is what the EOQ model in Unit 8 is built to resolve.
2Simple Explanation
3Example
A grocery store that carries $10 million worth of inventory at an estimated 30% annual carrying-cost rate is paying roughly $3 million a year just to hold that stock (insurance, storage, spoilage, capital tied up). Halving average inventory to $5 million would save about $1.5 million annually in carrying cost — which is exactly the kind of trade-off inventory models are designed to optimise.
4Important Points
- Carrying cost: grows with inventory level; typically 10–40% of item value per year; includes storage, handling, insurance, spoilage, capital cost.
- Ordering cost: roughly fixed per order; grows with the number of orders placed per year.
- Shortage cost: cost of unmet demand — lost sales/goodwill (external) or downtime (internal); often hard to estimate precisely.
- Larger order size → fewer orders (lower ordering cost) but more average inventory (higher carrying cost) — and vice versa.
5Exam-Ready Answer
Inventory decisions involve balancing three types of cost. Carrying cost, also called holding cost, is the cost of keeping an item in stock, including storage, insurance, material handling, spoilage or obsolescence, and the opportunity cost of capital invested in inventory; it increases linearly with the quantity of inventory held. Ordering cost is the cost associated with placing and processing a replenishment order, including paperwork, transportation, and receiving, and is largely independent of order size, meaning it rises with the number of orders placed per year rather than their size. Shortage cost, or stockout cost, is incurred when demand cannot be met due to insufficient inventory, resulting in lost sales, lost customer goodwill, or, for internally demanded items, production downtime. These costs behave inversely to one another: ordering larger quantities less frequently reduces ordering cost but increases carrying cost, while ordering smaller quantities more frequently has the opposite effect, and the objective of inventory control models such as the economic order quantity model is to find the order quantity that minimises the combined total of these costs.
Definition. Inventory costs fall into three main categories — ordering (setup), holding (carrying) and shortage (stockout) costs — and the whole of inventory theory is the search for the order quantity that minimises their total.
The three main cost categories
| Cost | What it includes | Behaviour with order size |
|---|---|---|
| Ordering / setup cost | Placing and processing the purchase order, transport and receiving, inspection, invoice handling; in production, the machine setup and changeover | Falls as order size rises — fewer orders per year |
| Holding / carrying cost | Capital tied up (usually the largest component), warehouse rent, handling, insurance, taxes, obsolescence, deterioration, pilferage | Rises as order size rises — more average stock held |
| Shortage / stockout cost | Lost profit on lost sales, backorder and expediting cost, loss of goodwill and future custom; internally, work stoppages, downtime and lost production | Falls as stock rises |
Stockout cost and reputation — the Final Exam's question
- A stockout occurs when customer demand cannot be met because of insufficient inventory.
- If the shortage results in a permanent loss of sales, shortage cost includes the lost profit.
- Shortages cause customer dissatisfaction and loss of goodwill, which can mean permanent loss of customers and future sales — the reputational damage far exceeds the single lost sale.
- When demand is internal, a shortage causes work stoppages and delays, producing downtime cost and the cost of lost production.
- Example: a pharmacy repeatedly out of a chronic-illness medicine loses not one sale but the patient's monthly repeat business permanently — and in the age of reviews, the complaint is public and durable.
Hidden costs of inventory — the Re-Exam's question
- Component devaluation cost — component prices usually fall by the time the product is released, forcing the firm to devalue the stock it holds.
- Price protection cost — a policy under which a retailer refunds the difference if an item's price drops after purchase; it forces shorter manufacturing turnaround, frequent replenishment, and incentives to distributors to keep stock low.
- Product return cost — unsold products resulting from excess inventory are returned by distributors, sometimes for a full refund.
- Obsolescence cost — short product life cycles make stock obsolete; new models must be launched only after existing stock clears the shelves.
The trade-off to state
- Ordering cost and holding cost move in opposite directions with order size — that opposition is what creates a minimum-cost order quantity.
- Shortage cost is the hardest to measure and the most damaging, because most of it is invisible: the customer who simply never returns.
Closing line: the visible costs of inventory sit on the balance sheet, but the expensive ones — obsolescence, devaluation and lost goodwill — mostly do not, which is why inventory is so consistently under-managed.
6Possible Exam Questions
- Explain the three types of inventory cost with examples.
- Why do carrying cost and ordering cost move in opposite directions as order size changes?
7Common Mistakes
- Describing ordering cost as increasing with order size — it is actually largely independent of order size and increases with the number of orders.
- ENInventory Management Explained: Concepts, Types, and CostsOperations & Supply Chain Management University
- HIInventory Management — Inventory Control & Importance (Hindi)Prince Learning Centre
- ENInventory Management — Meaning, ObjectivesStudent Notes
4. Inventory Control Systems: Continuous (Q) vs Periodic (P) Core syllabus concept
1Understand the Concept
An inventory control system answers two questions: how much to order, and when. There are two basic systems, and your syllabus refers to them by their shorthand names, 'Q' system and 'P' system.
A continuous inventory system (also called a perpetual system or fixed-order-quantity (Q) system) keeps a continual, real-time record of inventory level. Whenever stock falls to a predetermined reorder point, a new order for a fixed quantity (Q) is placed — so the order size never changes, but the time between orders varies depending on how fast demand depletes stock. A supermarket's barcode-scanner checkout, which updates inventory instantly with every sale, is a real-world example. The advantage is that management always knows the exact inventory status; the disadvantage is the cost of continuously monitoring inventory.
A periodic inventory system (fixed-time-period, or P system) checks inventory only at fixed time intervals (e.g. every week or month), and then places an order for whatever variable quantity is needed to bring stock back up to a target level. A university bookstore counting textbook stock at the start of each semester and ordering the shortfall is a classic example. The advantage is minimal record-keeping between review periods; the disadvantage is less direct control, which usually means a periodic system needs a larger safety stock than a continuous system to guard against running out during the (unmonitored) interval between reviews.
2Simple Explanation
3Example
Continuous (Q) system: A personal checkbook with 300 checks includes a reorder form after the 200th check is used — a fixed reorder point triggering a fixed-size replenishment.
Periodic (P) system: A drugstore's vendor visits every 30–60 days, counts remaining stock of an item, and orders whatever quantity brings it back up to the target level — the order quantity varies each visit, but the timing is fixed.
4Important Points
| Continuous (Q) System | Periodic (P) System | |
|---|---|---|
| Order quantity | Fixed | Variable |
| Time between orders | Variable | Fixed |
| Monitoring | Continuous (real-time) | Periodic (at review points only) |
| Record-keeping | Higher (constant tracking) | Lower (only at review time) |
| Safety stock needed | Lower | Higher (covers the review interval + lead time) |
5Exam-Ready Answer
There are two basic inventory control systems. The continuous, or fixed-order-quantity (Q), system maintains a continual record of inventory on hand and places an order for a fixed quantity whenever stock falls to a predetermined reorder point; the order size is always the same, but the time between orders varies with the rate of demand. This system keeps management continuously informed of inventory status but requires ongoing monitoring, which can be costly. The periodic, or fixed-time-period (P), system instead checks inventory only at fixed time intervals and places an order for a variable quantity sufficient to bring stock back up to a target level; the time between orders is fixed, but the order quantity varies. This system requires much less record-keeping between review periods but offers less direct control, and typically requires a larger safety stock to protect against stockouts during the unmonitored interval between reviews. A students' bookstore ordering textbooks once each semester is a typical example of a periodic system, while a barcode-scanning retail checkout that updates stock in real time is a typical example of a continuous system.
Definition. An inventory control system decides when to order and how much. The continuous (Q) system monitors stock constantly and orders a fixed quantity whenever stock hits the reorder point. The periodic (P) system checks stock at fixed time intervals and orders a variable quantity to top up to a target level.
Point of difference — draw this table
| Basis | Continuous / Q system (fixed-order-quantity, perpetual) | Periodic / P system (fixed-time-period) |
|---|---|---|
| When to order | When stock falls to the reorder point — timing varies | At fixed review intervals — timing is regular |
| How much to order | Fixed quantity (usually the EOQ) | Variable — enough to reach the target level |
| Monitoring | Continuous — every withdrawal recorded | Only at the review date |
| Record-keeping effort | High — needs a perpetual system | Low |
| Safety stock needed | Less — protects only over the lead time | More — must protect over review period + lead time |
| Average inventory | Lower | Higher |
| Suits | High-value A items; critical items; items with steady demand | Low-value C items; many items from one supplier; routine deliveries |
| Example | Supermarket barcode scanning triggering replenishment | A vendor visiting a pharmacy every 60 days and topping up |
Why the P system needs more safety stock — the key insight
- In a Q system, stock is watched continuously, so a demand surge is detected immediately and only the lead time is exposed.
- In a P system, nobody looks between reviews, so a surge just after a review goes unnoticed until the next one — the exposure is the review period plus the lead time.
- Longer exposure means more uncertainty to cover, hence larger safety stock and higher average inventory. That is the price paid for lower monitoring effort.
How to recommend one — the application skill
- Choose Q when the item is expensive or critical, when stockouts are costly, and when the firm already has barcode/ERP tracking that makes continuous monitoring free.
- Choose P when items are cheap and numerous, when many items come from one supplier and can be consolidated into a single order, or when the supplier delivers on a fixed schedule anyway.
- Many firms use both, allocated by ABC class — Q for A items, P for C items.
Example
- A pharmacy uses a Q system for expensive prescription drugs where a stockout is serious and stock is tracked electronically; and a P system for over-the-counter items, because the vendor calls every 60 days anyway and consolidating one large order is cheaper than tracking hundreds of low-value lines.
Closing line: the choice between P and Q is a trade of monitoring effort against inventory investment — Q spends attention to save stock, P spends stock to save attention.
6Possible Exam Questions
- Differentiate between the continuous (Q) and periodic (P) inventory systems.
- Why does a periodic inventory system generally require a larger safety stock than a continuous system?
- Suggest which inventory system (P or Q) would suit a small pharmacy's stock of over-the-counter medicines, with reasoning.
7Common Mistakes
- Mixing up which variable is "fixed" in each system — remember: Quantity is fixed in the Q system; the time Period is fixed in the P system.
- ENLecture 13: Inventory ManagementEddy Witzel
- ENInventory Management Explained: Concepts, Types, and CostsOperations & Supply Chain Management University
5. ABC Classification (Selective Inventory Control) Core syllabus concept
1Understand the Concept
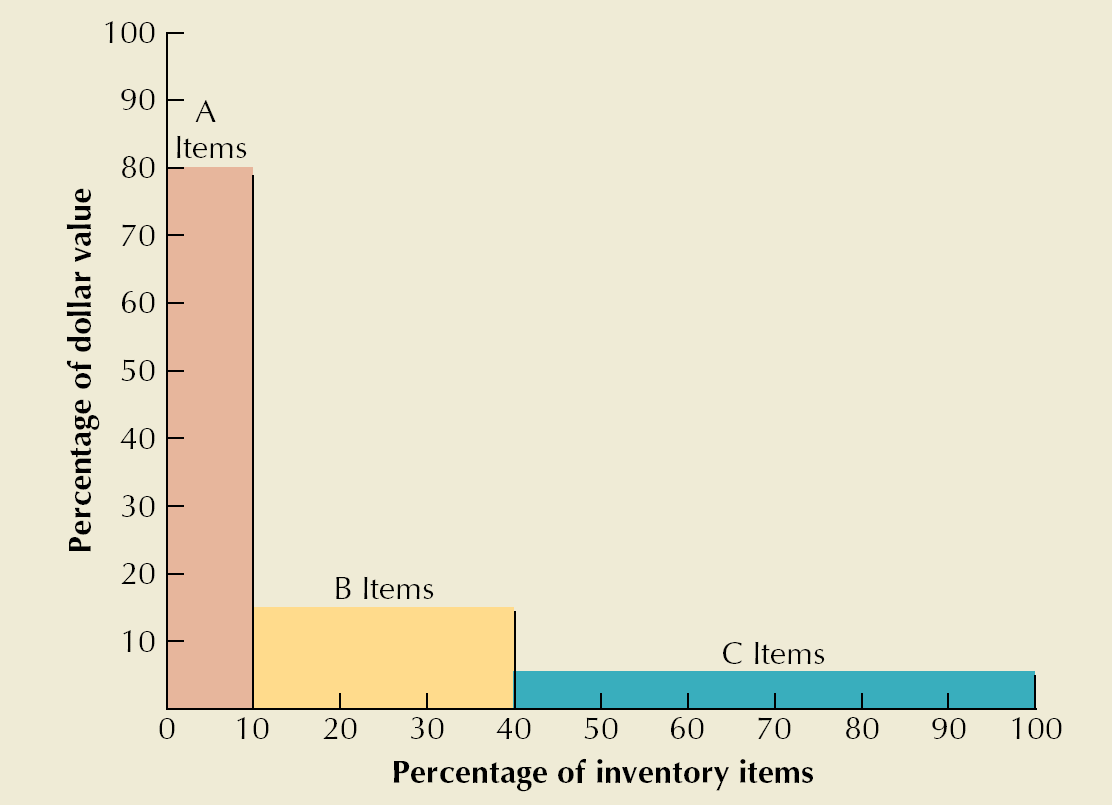
A real firm may carry thousands of different inventory items, but it obviously can't afford to apply the same tight, expensive control to all of them. ABC classification (a form of selective inventory control) solves this by applying the Pareto (80/20) principle to inventory: a small number of items typically account for the large majority of total inventory value, so control effort should be concentrated there.
Each item is assigned a dollar value (unit cost × annual usage/demand), all items are ranked by this value, and then split into three classes: Class A items are roughly 5–15% of all items but represent 70–80% of total inventory value — these deserve tight control, accurate forecasting, and low safety stock. Class B items are around 30% of items and 15% of value — moderate control. Class C items are 50–60% of items but only 5–10% of value — minimal control (simple observation is often enough), since tight monitoring here isn't worth the effort relative to the value at stake.
2Simple Explanation
3Example
A maintenance department stocks 10 spare parts with different unit costs and annual usage. Ranking each part by Total Value = Unit Cost × Annual Usage and computing cumulative % of value shows that just 3 parts (Parts 9, 8, 2) account for 71% of total value using only 15% of total quantity — these become Class A. The next 3 parts (16.5% of value, 28% of quantity) become Class B, and the remaining 4 parts (12.5% of value, 57% of quantity) become Class C.
This is exactly the same example your lecture PPT uses (labelled there as "Example 10.1" from a different textbook edition's numbering) — the method and conclusion are identical.
4Important Points
- Item value = Unit cost × Annual usage/demand — rank all items by this value.
- Class A: ~5–15% of items, ~70–80% of value → tight control, accurate forecasts, low safety stock.
- Class B: ~30% of items, ~15% of value → moderate control.
- Class C: ~50–60% of items, ~5–10% of value → minimal control, higher safety stock is acceptable since holding cost is low.
- Also called selective inventory control because it deliberately applies different levels of control to different items instead of one uniform policy.
- Class A items are the natural candidates for the EOQ/reorder-point models covered in Units 8–9, since the payoff from optimising them is largest.
5Exam-Ready Answer
ABC classification is a method of selective inventory control that categorises inventory items according to their dollar value to the firm, based on the principle that a small percentage of items typically account for the largest share of total inventory value. Each item's annual dollar value is computed by multiplying its unit cost by its annual usage, and items are ranked from highest to lowest value. Class A items, typically around 5 to 15 percent of all items, account for roughly 70 to 80 percent of total inventory value and require tight inventory control, accurate demand forecasting, and minimal safety stock. Class B items, around 30 percent of items and 15 percent of value, require moderate control, while Class C items, making up 50 to 60 percent of items but only 5 to 10 percent of value, require only minimal control since the cost of tightly monitoring them would exceed the benefit. This selective approach allows a firm to concentrate its limited inventory-management effort where it has the greatest financial impact, rather than applying the same level of control uniformly across thousands of items.
Definition. ABC classification is a selective inventory control technique that divides inventory items into three classes by their annual rupee usage value, so that management attention is concentrated where the money is. It is an application of the Pareto (80/20) principle.
The three classes
| Class | Typical % of items | Typical % of annual value | Control policy |
|---|---|---|---|
| A | ~10–20% | ~70–80% | Very tight control; accurate and complete records; frequent review; continuous (Q) system; close supplier relationships; low safety stock but high accuracy |
| B | ~30% | ~15–25% | Moderate control; good records; periodic review; normal processing |
| C | ~50–60% | ~5–10% | Simplest possible control; minimal records; large orders placed infrequently; generous safety stock — it is cheap |
The steps
- For each item, compute annual usage value = annual demand × unit cost.
- Rank all items in descending order of that value.
- Compute the cumulative percentage of total value.
- Cut the list into A, B and C classes at the natural breaks.
- Apply a different control policy to each class.
The key principle — and the classic mistake
- Classification is by annual rupee usage, not unit price and not quantity. A cheap item consumed in huge volume can be class A; an expensive item bought once a year can be class C.
- The logic: control effort is itself costly, so spend it where it saves the most money.
- Important caveat — a class C item can still be critical. A ₹20 gasket that halts a production line must not be managed loosely just because its annual value is low. This is exactly why VED analysis (Vital / Essential / Desirable) is used alongside ABC, and the two are often combined into an ABC–VED matrix.
Other selective inventory control techniques worth naming
- VED — Vital, Essential, Desirable: by criticality to operations.
- FSN — Fast, Slow, Non-moving: by consumption rate; identifies dead stock.
- HML — High, Medium, Low: by unit price alone.
- XYZ — by value of stock actually held in the storeroom.
- SDE — Scarce, Difficult, Easy to obtain: by procurement difficulty.
Example
- A hospital pharmacy stocking 3,000 line items finds that 250 of them account for 78% of annual spend. Those become class A with weekly review and a Q system. But it separately flags a handful of low-value emergency drugs as Vital under VED and stocks them generously despite their class C status — because the cost of a stockout is not measured in rupees.
Closing line: ABC analysis is about the allocation of management attention, not of stock — its value lies in giving the manager permission to stop worrying about the 60% of items that account for almost none of the money.
6Possible Exam Questions
- Explain ABC classification / selective inventory control with an example.
- Given unit cost and annual usage data for a set of items, classify them into A, B, and C categories.
- Why do Class C items not need the same level of inventory control as Class A items?
7Common Mistakes
- Ranking items by unit cost or annual usage alone, instead of their product (total value).
- Assuming Class A means "most units," when it actually means "most value," often from relatively few units.
- ENSelective Inventory Control Techniques | ABC | VED | XYZ | FNSD AnalysisDr. Madhusudhana Rao Cuddapah
- HIABC Analysis in Inventory Management (Hindi)Online Tutorial by Vaishali
- HIInventory Control Techniques — ABC, VED, SDE, FNSD, XYZ, HML | Operations | BBA MBADWIVEDI GUIDANCE
- ENInventory Control Techniques — ABC / FSN / HML / VEDManagement Tutorials